The term “business intelligence” refers to the use of data in a company to facilitate decision making. It includes the understanding of the current operation of the company, as well as the anticipation of future events, with the aim of offering knowledge to back up business decisions. A Business Intelligence solution starts from the different information systems of an organization (database, ERPs, text files ...), on which it is usually necessary to apply a structural transformation to optimize its analytical process. The latter may acquire three different functions:
- Analysis
- Control and monitor
- Reporting
In this guide you will find all the information about the BI tool that Juniper offers, which will resolve all your queries on how to use it.
Juniper’s BI module is designed to cover most Juniper IT customer needs. Even so, it is possible that the Company may have specific needs that require a personalized solution.
Juniper provides you the possibility to implement specific reports, or the combination of different set of data to extract compound information that can be useful according to your interests. To do this, you may contact your commercial agent, where we will advise and inform you about the conditions for a personalized development.
¶ BI architecture
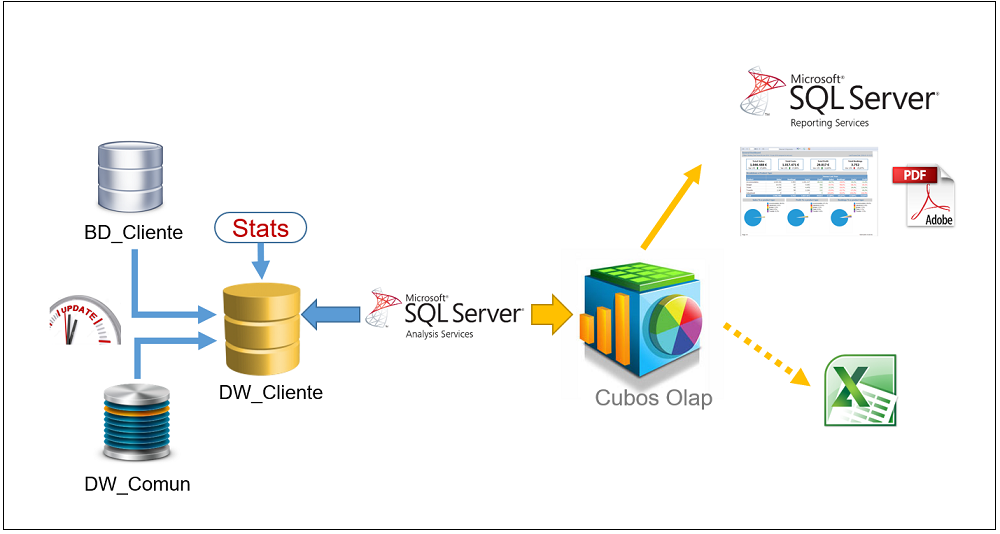
The first step of the process consists in creating a DW_Cliente, as Business Intelligence never accesses the production DBs. Indeed, the data is imported from the database to the DW. Let us clarify what a Datawarehouse is. The Datawarehouse is a corporate database that consists in integrating and debugging information from one or several different sources, and then processing it, allowing its analysis from a myriad of perspectives and with great response speeds.
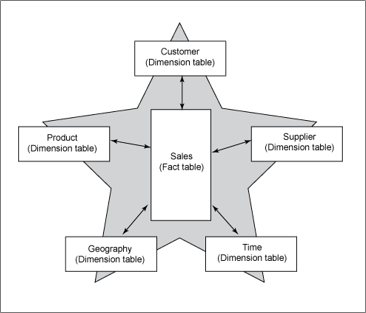
All cubes are designed following a star model.
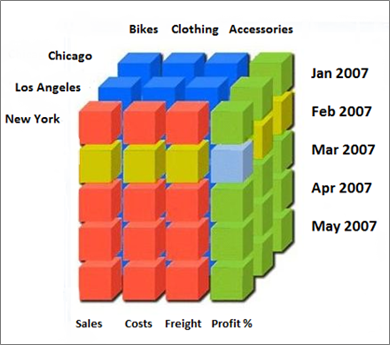
¶ What are OLAP Cubes?
OLAP is the acronym in English for Online Analytical Processing (Online Analytical Processing). The data is indexed and grouped by criteria in order to obtain them in a faster way.
Juniper can storage huge amount of data, working with such amount is difficult. Let take as example the bookings done in our system, if we would like to check the bookings done by our clients, we would have to run a process, which would go over all the registers that match our criteria, being time consuming. Furthermore, if we add other criteria’s such as dates, we would have to run the process all over again, so this is not the most optimal method to work with the data in the most efficient manner.
We use the processing OLAP, we are able to group the data by clients and date being faster at the time to analize the data unlike the previous case. Although you wont be able to get details of the bookings such as the Booking Code, final customer, if we wish such a detail there other tools to get them.
All cubes are segmented into measures and dimensions.
Measures
It consists of numerical facts, which are classified by dimensions, that is, filters such as customers, areas, dates, etc. The measures are obtained from the records of a fact table: Sum (ReservationPrice), Count (Reservations).
Dimensions
They are each of filters that we can apply: hotel, date, etc.
From this moment on, you may browse the menu that has been distributed, following the same structure you would see in the reports on the website.