¶ Main dashboard
This module shows an overview about product-type trend.
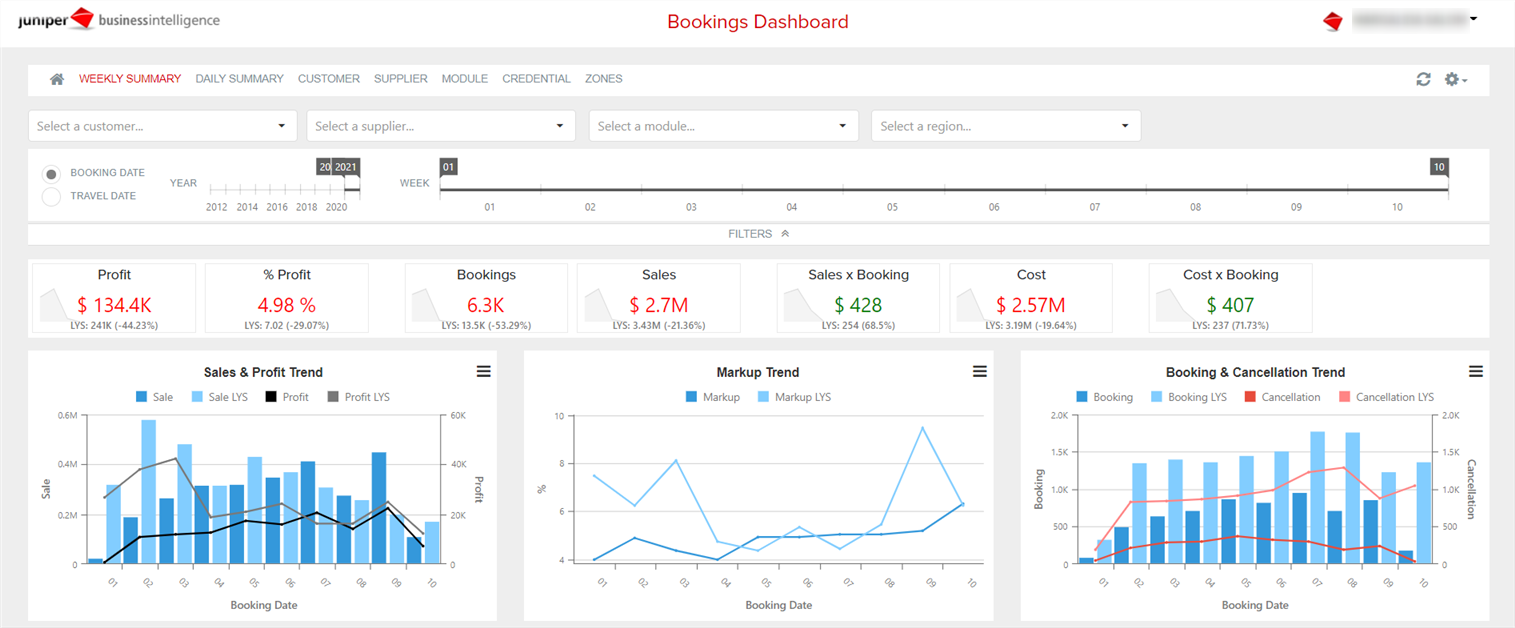
Tab 1: Weekly Summary
This dashboard shows weekly evolution of sales, costs, pofit and No. of bookings, among others. It is build by the following figures:
- Sales & Profit Trend: sales and profit trend for each week compared with previous year.
- Markup Trend: bookings markup compared with the last year.
- Bookings & Cancellation Trend: bookings and booking cancellations trend.
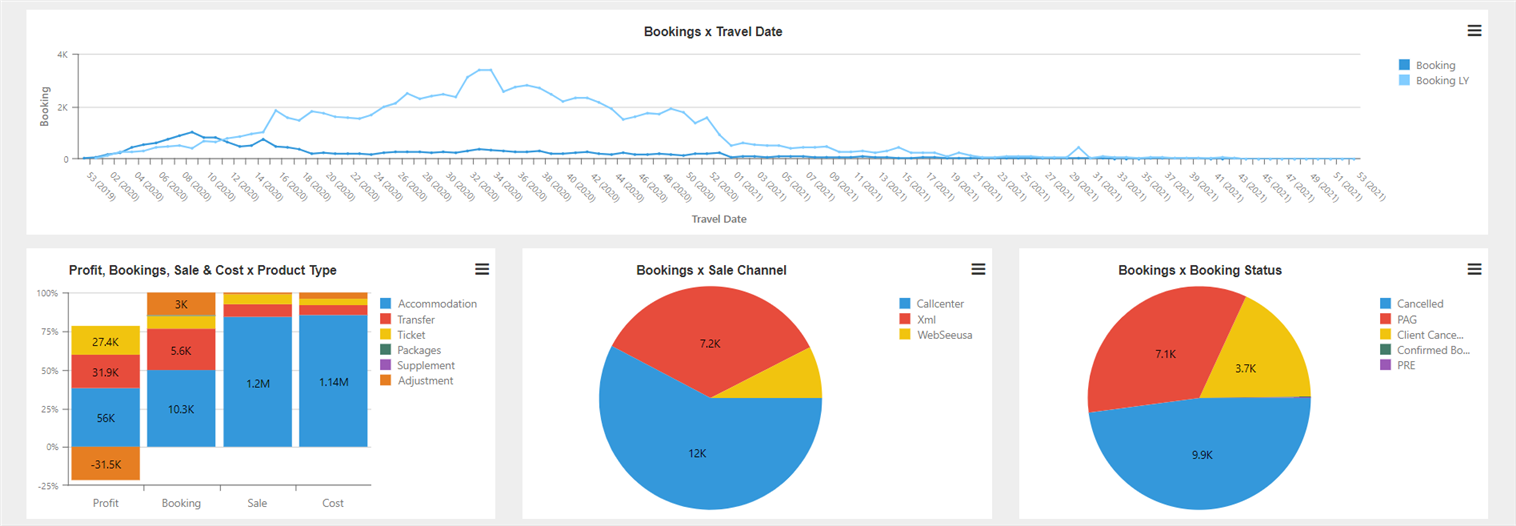
- Bookings x Travel Date: bookings trend depending on travel week.
- Profit, Bookings, Sale & Cost x Product Type: profit, bookings, sales and cost for each product type during the period of time selected on the filters.
- Bookings x Sale Channel: No. of bookings for each channel.
- Bookings x Booking Status: No. of bookings for each status (payed, confirmed, cancelled, etc.).
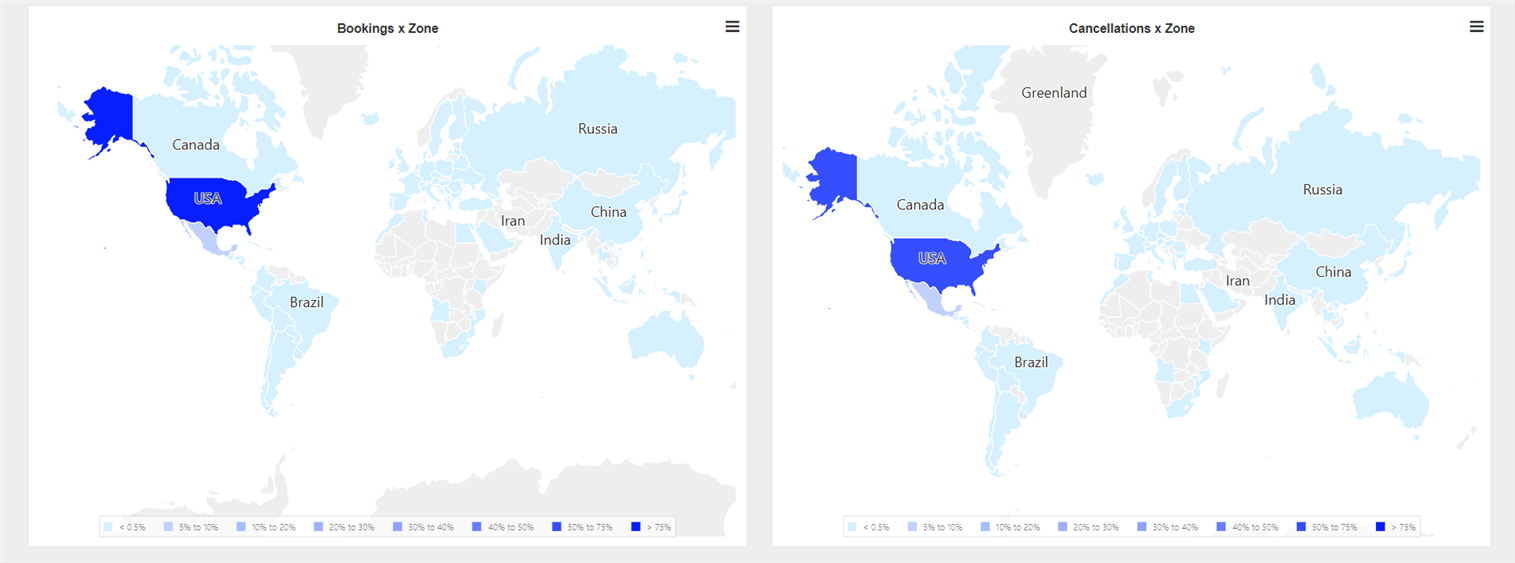
- Bookings x Zone: No. of bookings in each area.
- Cancellations x Zone: No. of bookings cancellations of each area.
Note: In the available report options, there are some that have the following abbreviation "LY" or "LYS": Which means:
- LY (Last Year): It stands for “last year”, and it is related by month and No. of day. For example, 30-May-2018 is compared to 30-May-2017.
- LYS (Last Year Slided): It means that in past years, it compares by day of the week with the purpose of comparing similar days and conditions. For example: 30-may-2018 Wednesday is compared to the 31-may-2017 on Wednesday.
Tab 2: Daily Summary
Same information that in the previous dashboard broken down by daily information.
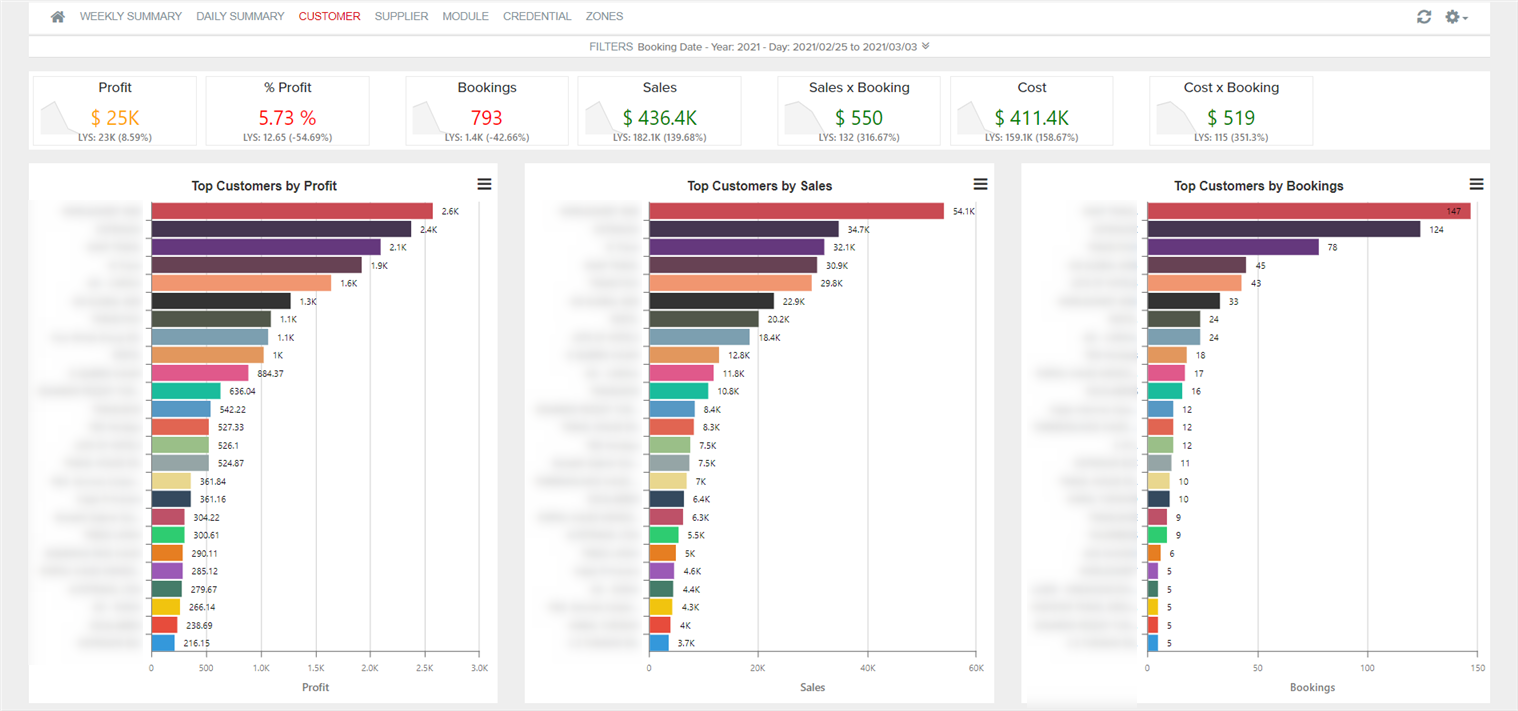
Tab 3: Customer
This dashboard shows sales, profit, bookings trend and bookings cancelled trend for each client. The dashboard is build of the following graphics:
- Sales & Profit Trend: sales and profit trend per day compared with previous year.
- Markup Trend: bookings markup per day compared with the last year.
- Bookings & Cancellation Trend: bookings and booking cancellations trend.
- Bookings x Travel Date: bookings trend depending on travel day.
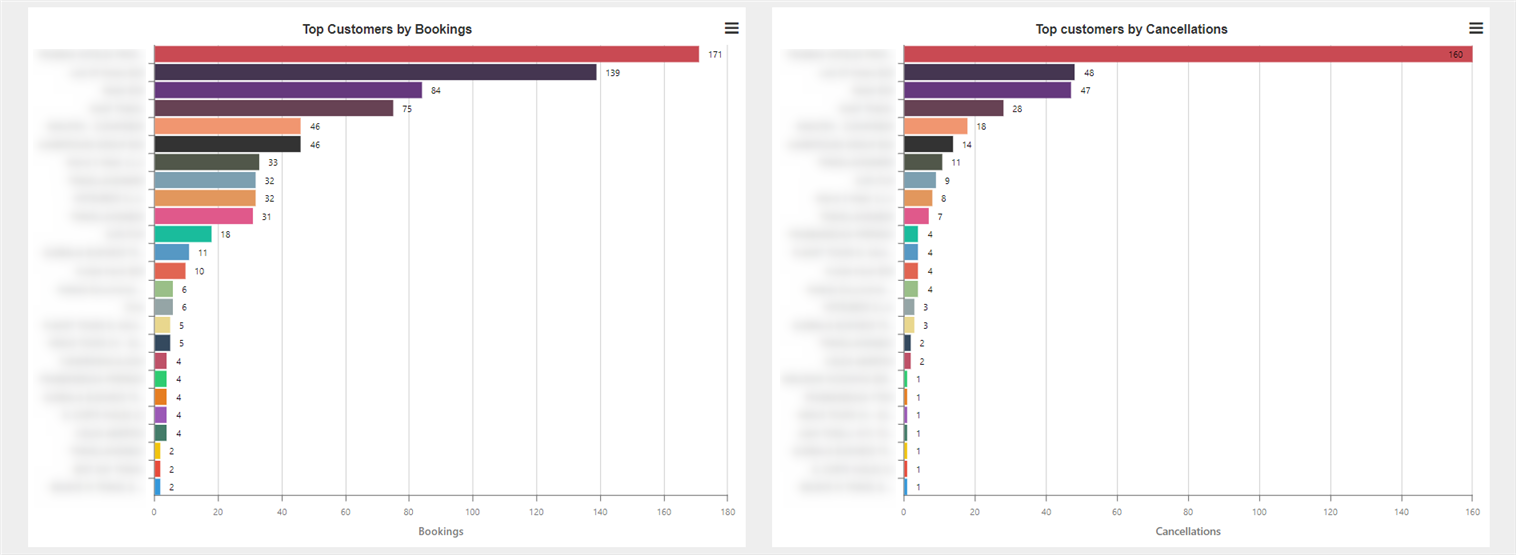
- Top Customers by Bookings: top clients with higher amount of bookings.
- Top customers by cancellations: top clients with higher amount of cancellation bookings.
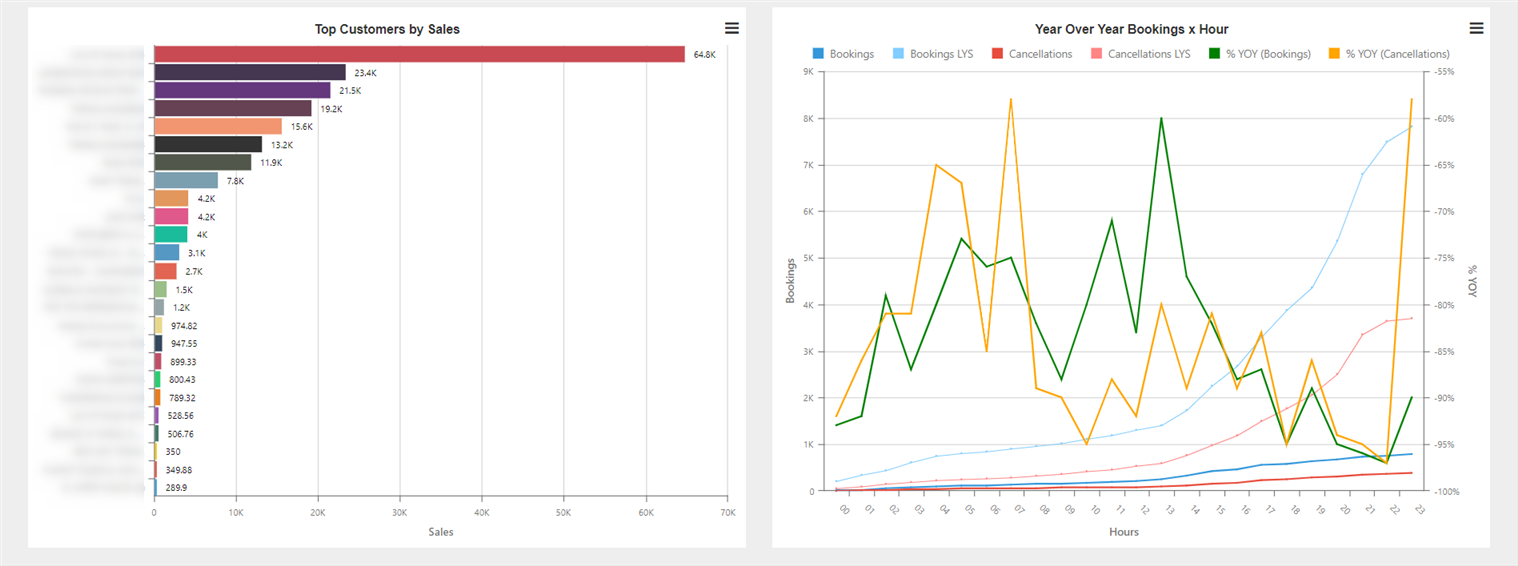
- Top customers by Sales: top clients in sales.
- Year Over Year Bookings x Hour: total No. of bookings and cancelled bookings of last year and the current year. The value of each hour is cumulative, this is the last value is the total No. of bookings. You will also see the booking variation percentage and cancelled bookings with regard to last year. This value is not cumulative.
Tab 4: Supplier
Same information that in the previous dashboard broken down by supplier and information about they.
Tab 5: Module
Same information that in the previous dashboard broken down by module.
Tab 6: Credential
Same information that in the previous dashboard broken down by supplier credential.
Tab 7: Zones
Same information that in the previous dashboard broken down by areas.
¶ Hotel
In the next section we will explain the different reports that exist to give you information about the sales and bookings of your business.
¶ 1. Hotel Dashboard
Whith this report you can view information related to bookings of your business.
At the top of the dashboard you have different filters available that allow you to select customers, suppliers, hotels or desired dates, among others. By preshing on a column or on an area in the graphs, it is filtered by said information and the rest of the graphs are dynamically updated. Additionally, clicking on the secondary button of your mouse over a graph it displays the option View Full Screen, which allows you to see the graphs in full screen and a summary table of the data. In the upper right part, from settings>zoom, you can activate the zoom mode that allows you to zoom the graphs with the movement of the mouse.
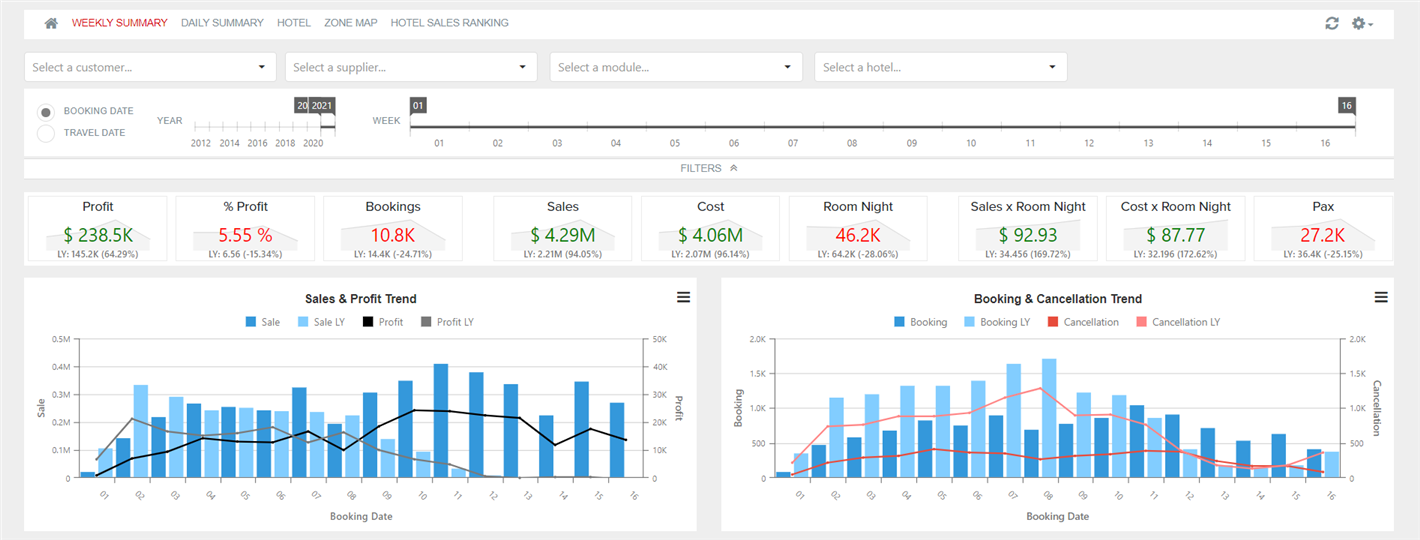
Tab 1: Weekly Summary
This tab allows you to compare the evolution of the information by weeks.
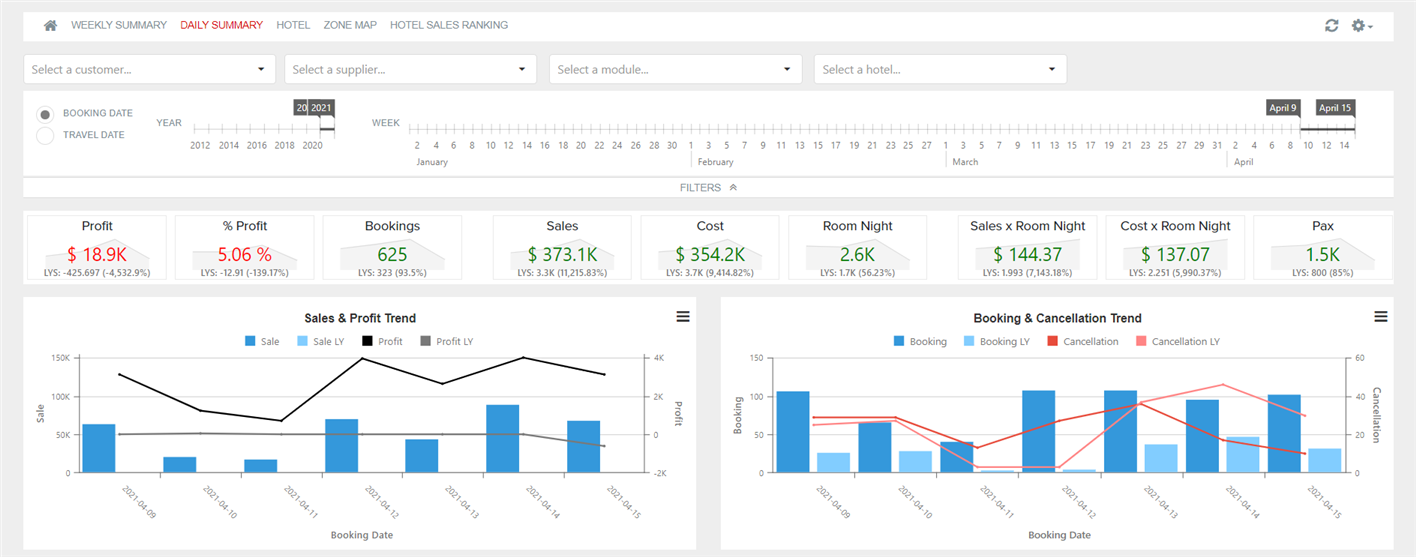
- Sales & Profit Trend: trend of sales and profit by week.
- Booking & Cancellation Trend: trend of bookings and cancellations per week.
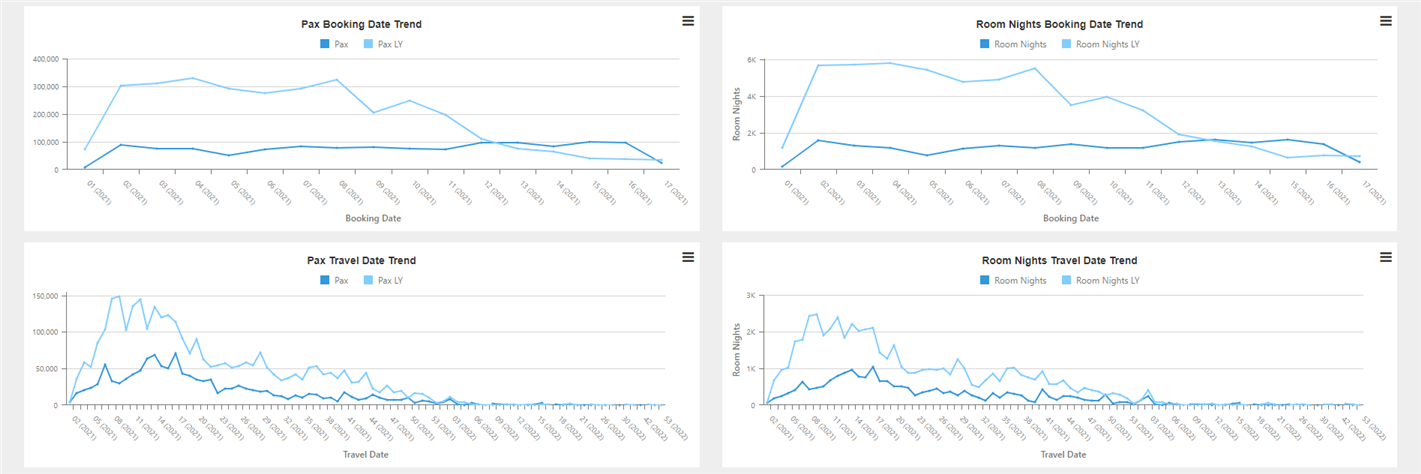
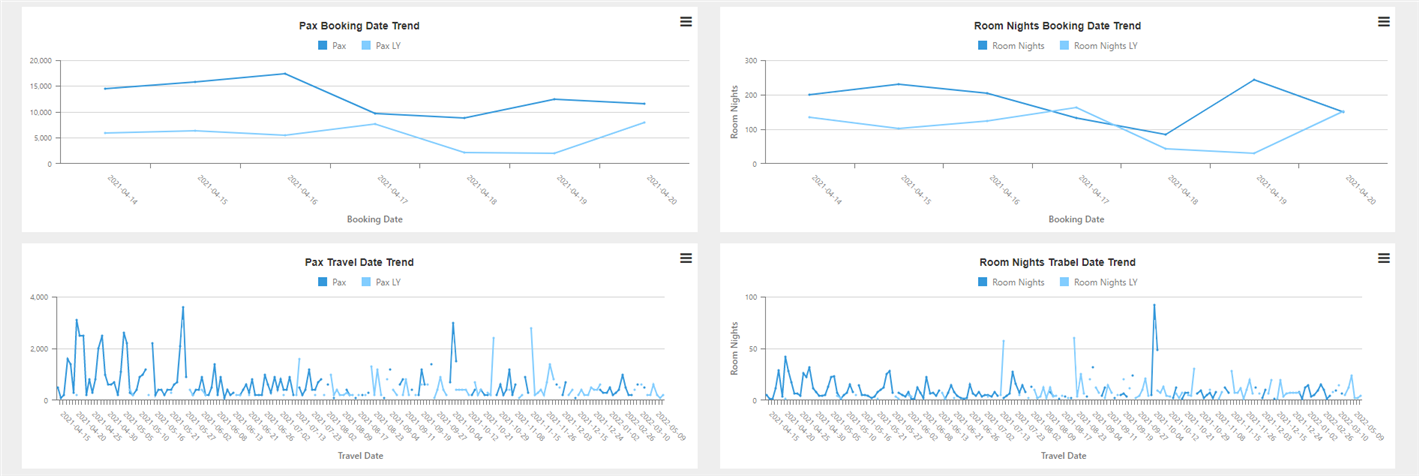
- Pax Bookings Date Trend: trend of passengers according to booking date.
- Room Nights Booking Date Trend: trend of room nights booked according to booking date.
- Pax Trend Date Trend: trend of passengers according to travel week.
- Room Nights Travel Date Trend: trend of room nights booked according to travel date.
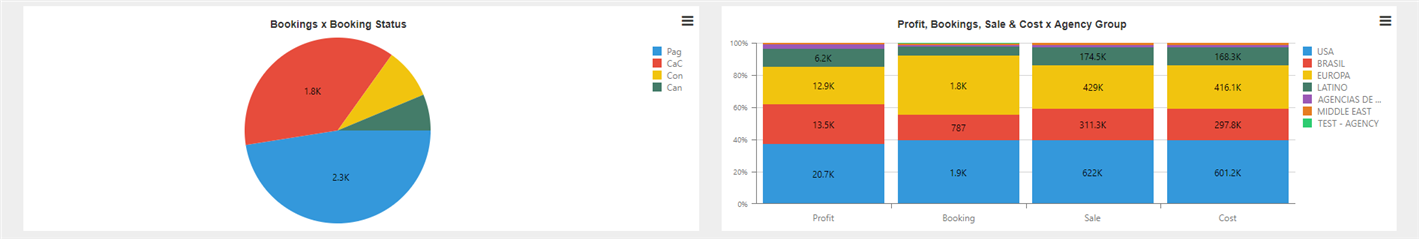
- Bookings x Booking Status: amount of bookings according to booking status.
- Profit, Bookings, Sale & Cost x Agency Group: profit, bookings, sale and cost percentage per each group of agencies according to total values.
Tab 2: Daily Summary
Dashboard similar to previous one broken by dates.

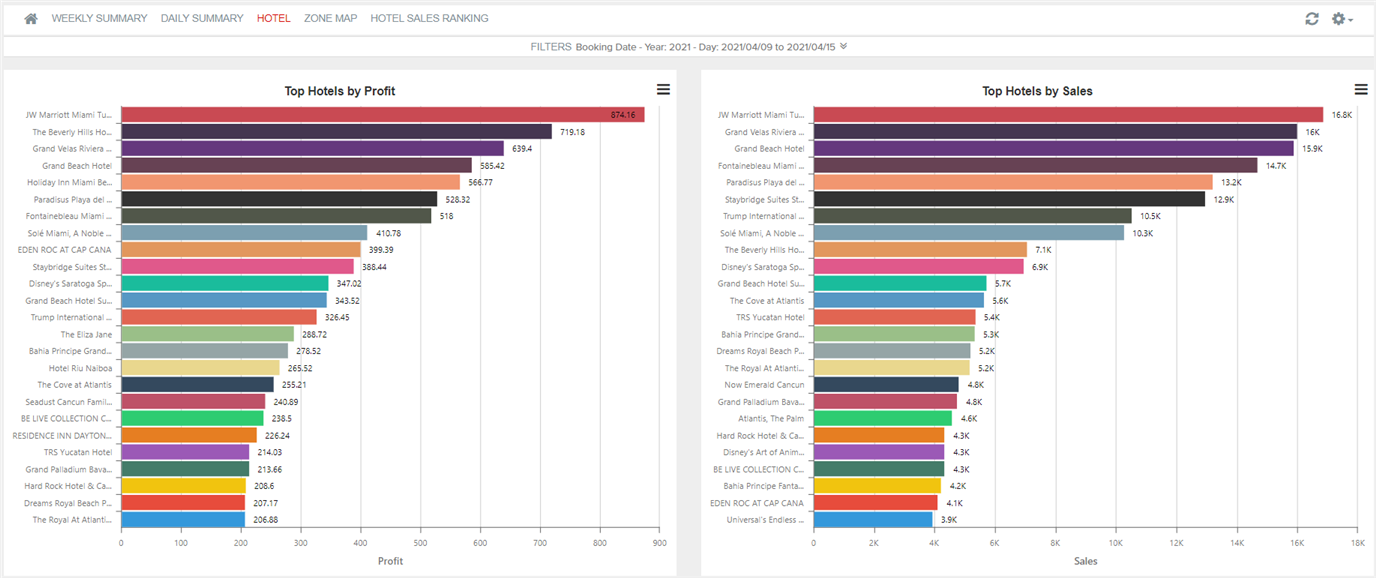
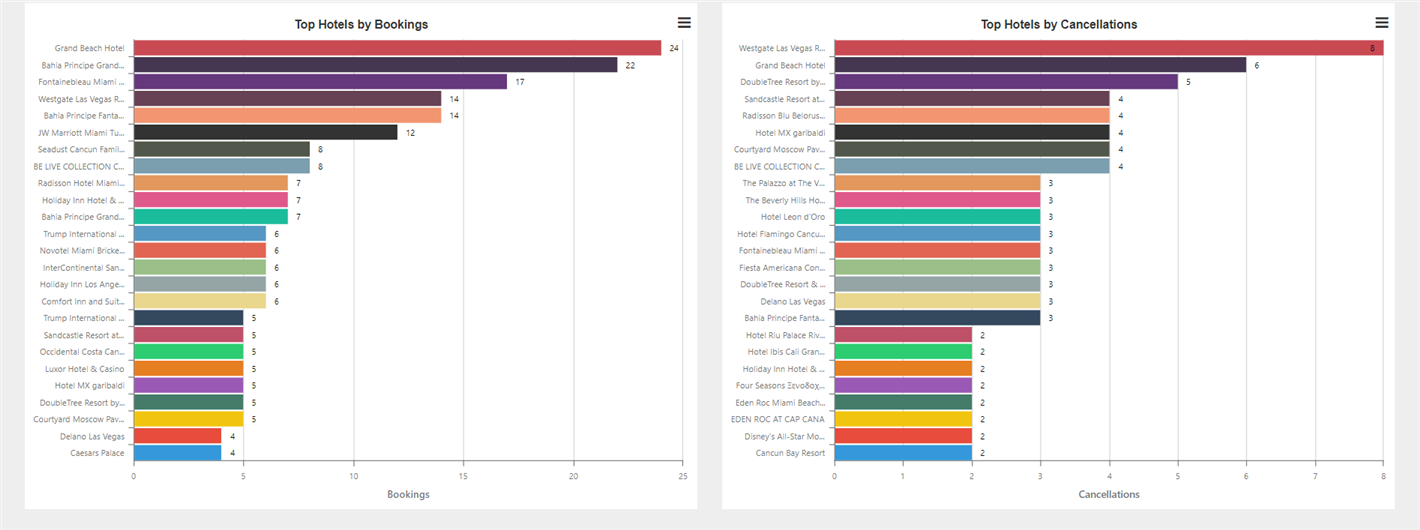
Tab 3: Hotel
This tab shows you information about hotels with high amount of bookings.
- Top Hotels by Profit: top hotels with highest profit during selected dates.
- Top Hotels by Sales: top hotels with highest sales during selected dates.
- Top Hotels by Bookings: top hotels with highest amount of bookings.
- Top Hotels by Cancellations: top hotels with highest amount of cancellations.
Tab 4: Zone Map
This tab shows you information about top areas with highest amount of bookings and cancellations.
- Bookings x Zone: amount of bookings on each zone.
- Cancellations x Zone: amount of cancellations on each zone.
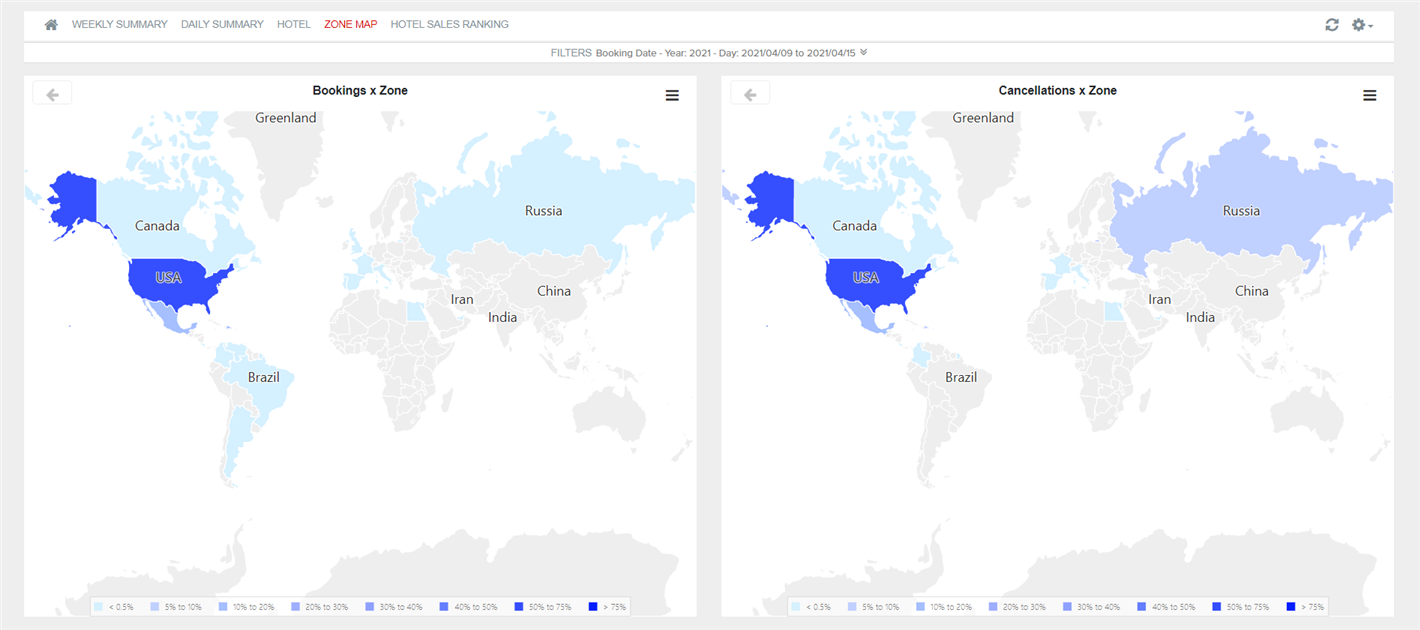
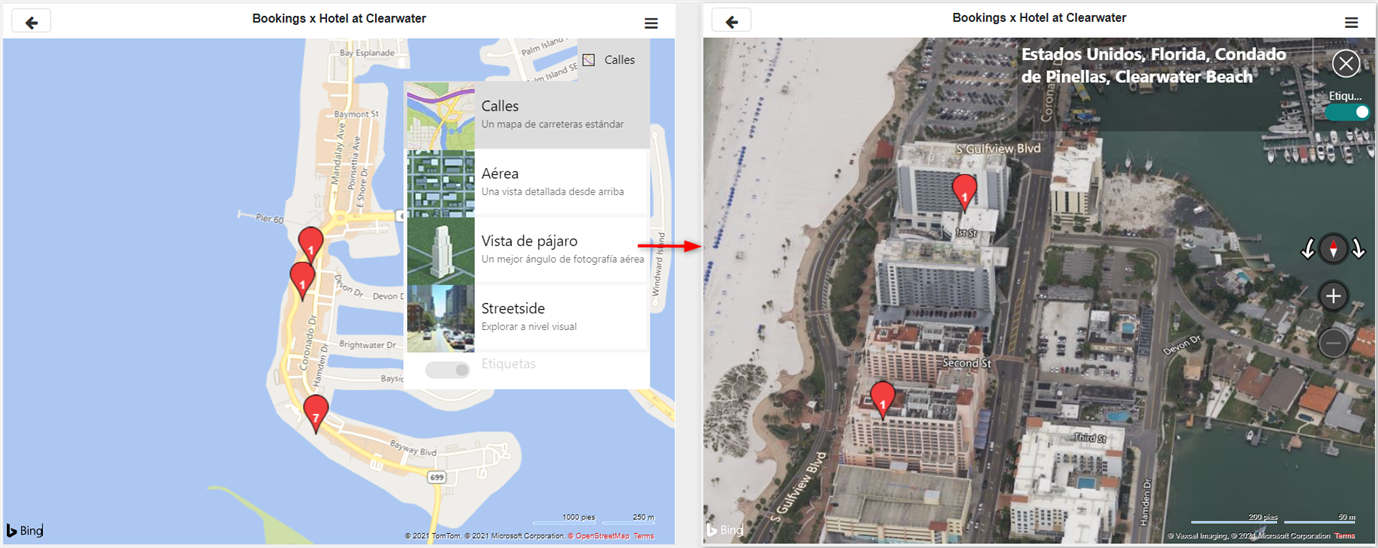
Selecting on the graph the desired area on the graph, you can see more detail about booked zones and change the view in order to know the exact location.
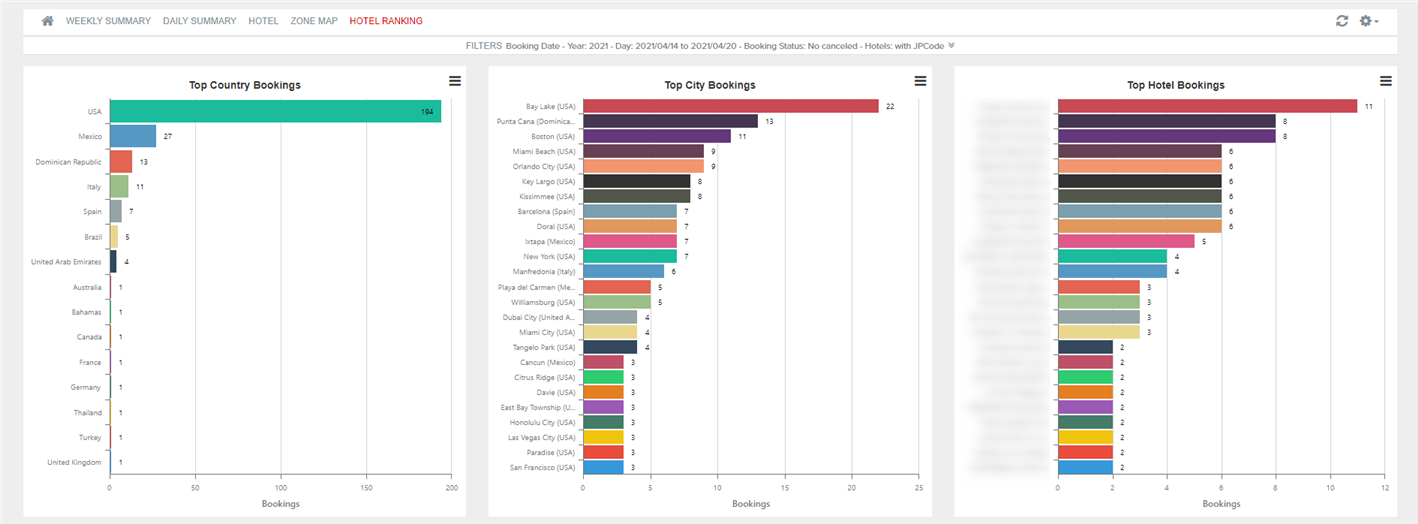
Pestaña 5: Hotel Ranking
This tab shows you information about zones more booked.
- Top Country Bookings: top countries with highest amount of bookings.
- Top City Bookings: top cities with highest amount of bookings.
- Top Hotel Bookings: top hotels with highest amount of bookings.
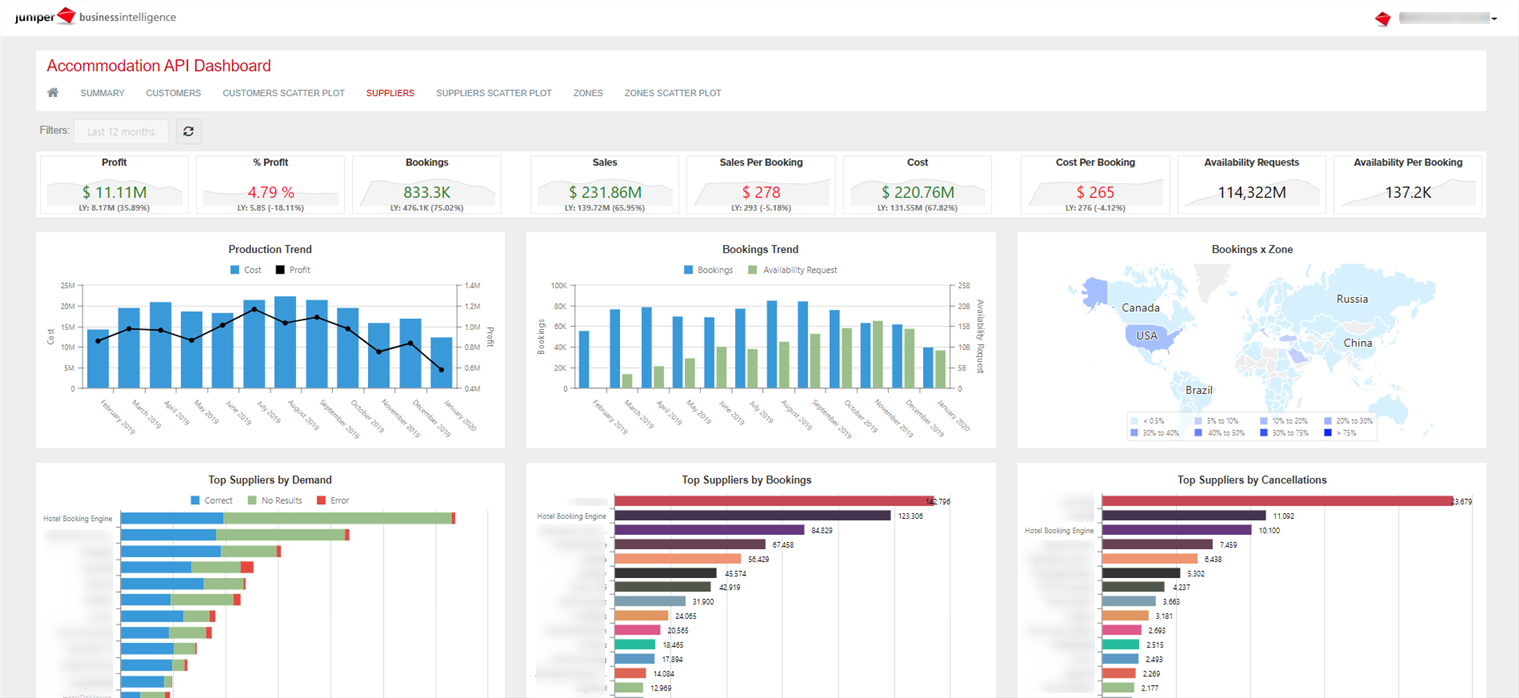
¶ 2. Accommodation API Dashboard
This report shows a combination of sales, profit and costs of the hotels sold. Moreover, you can see the zones sold and the percentage of most significant errors.
Selecting a column or an area in the graphs, it is filtered by that information and the rest of the graphs are updated dynamically. In addition, pressing the secondary mouse button on top of a graph the option View Full Screen is displayed and you can see full screen graphs and a summary table of the data. In the upper right, from settings > zoom, you can activate the zoom mode which allows you to zoom the graphics with the mouse scroll.
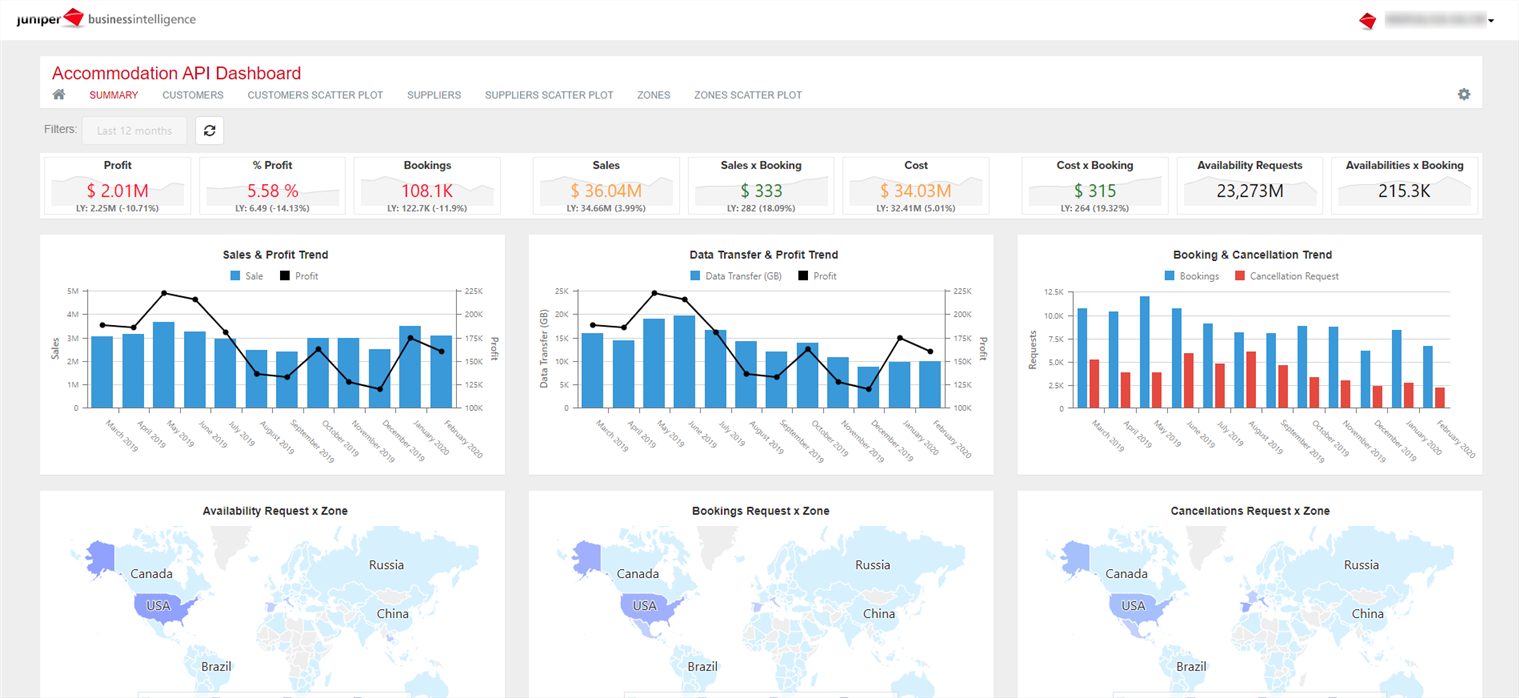
Tab 1: Summary
This dashboard provides an overview of the sales, costs and profit of hotel reservations, in addition to the most requested areas.
The dashboard is composed of the following graphics:
- Sales & Profit Trend: trend of sales and profit by month.
- Data Transfer & Profit Trend: GB consumed and profit trend by month.
- Bookings & Cancellation Trend: trend of bookings and cancellation policy requests by month.
- Availability/Bookings/Cancellations Requests x Zone: percentage of requests by zone of each type. By placing the cursor on the map area, you can see the total number of requests or the most requested cities.
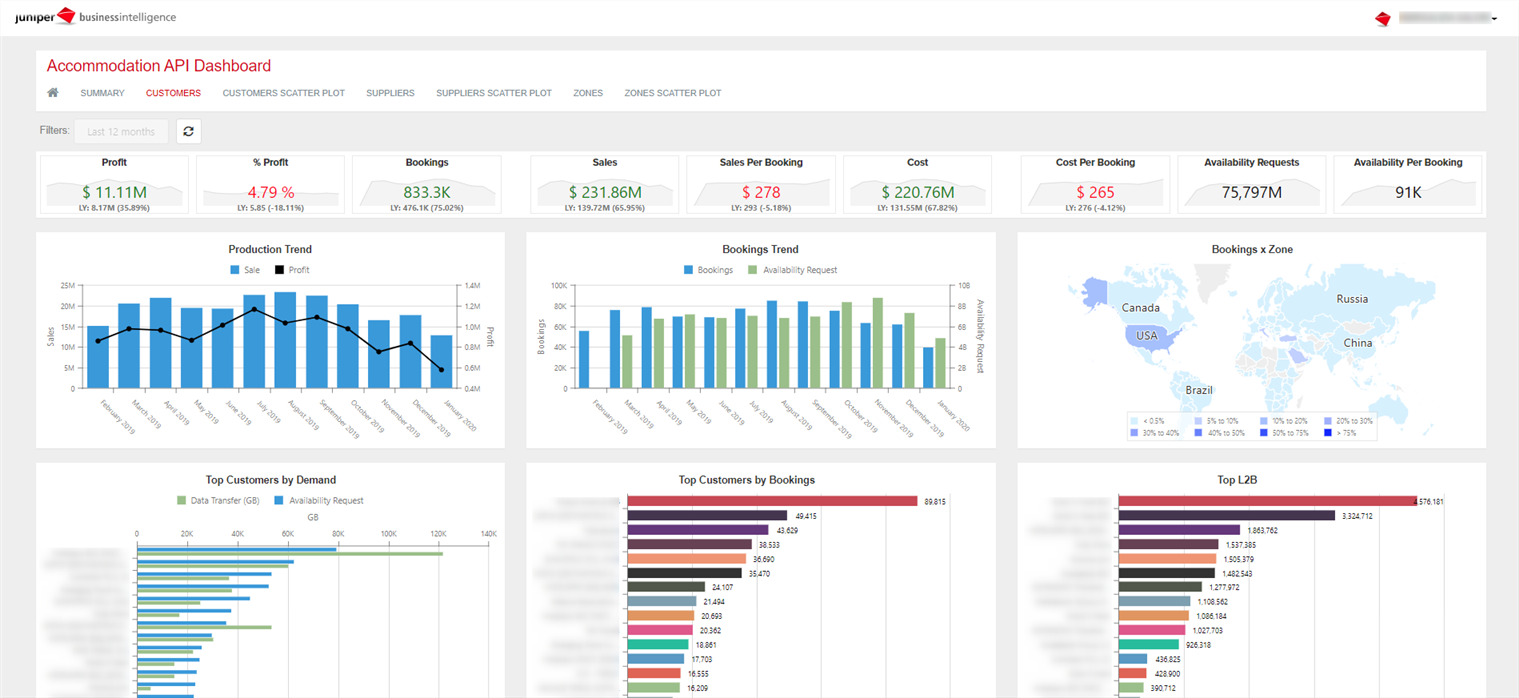
Tab 2: Customers
This dashboard provides an overview of customers, as well as sales, more booked areas, L2B or top customers with more errors. It is composed of the following graphs:
- Production Trend: monthly sales and profit trend.
- Bookings Trend: trend of bookings and availability requests by month.
- Bookings x Zone: bookings percentage by zone. By placing the cursor on the map area you can see the total number and percentage of reservations and the clients with the most representation.
- Top Customers by Demand: GB and availability requests by client during the selected dates.
- Top Customers by Bookings: bookings and percentage of bookings by client during the selected dates.
- Top L2B: Look2Book by client during the selected dates.
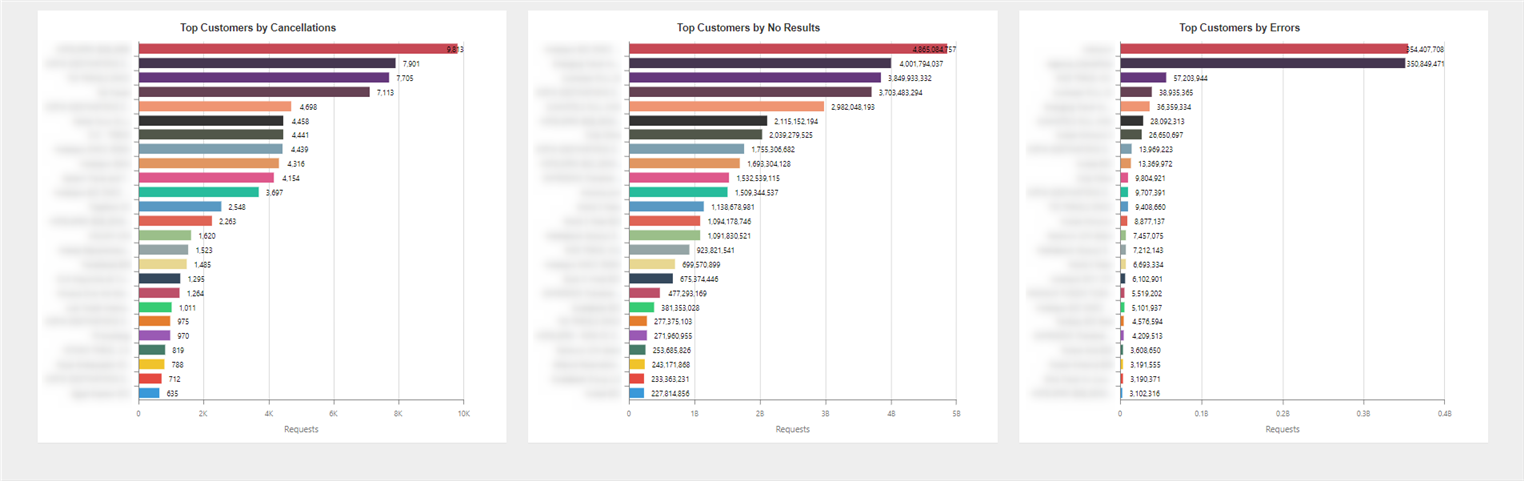
- Top Customers by Cancellations: cancellation policy requests of each client.
- Top Customers by No Results: amount of no results returned to each client. By placing the cursor on each bar, you can also see the number and perfentage of requests.
- Top Customer by Errors: amount of requests with error by customer. Most Cliente Final errors refer to login errors, while those recorded as Unknown are errors that have occurred before logging in.
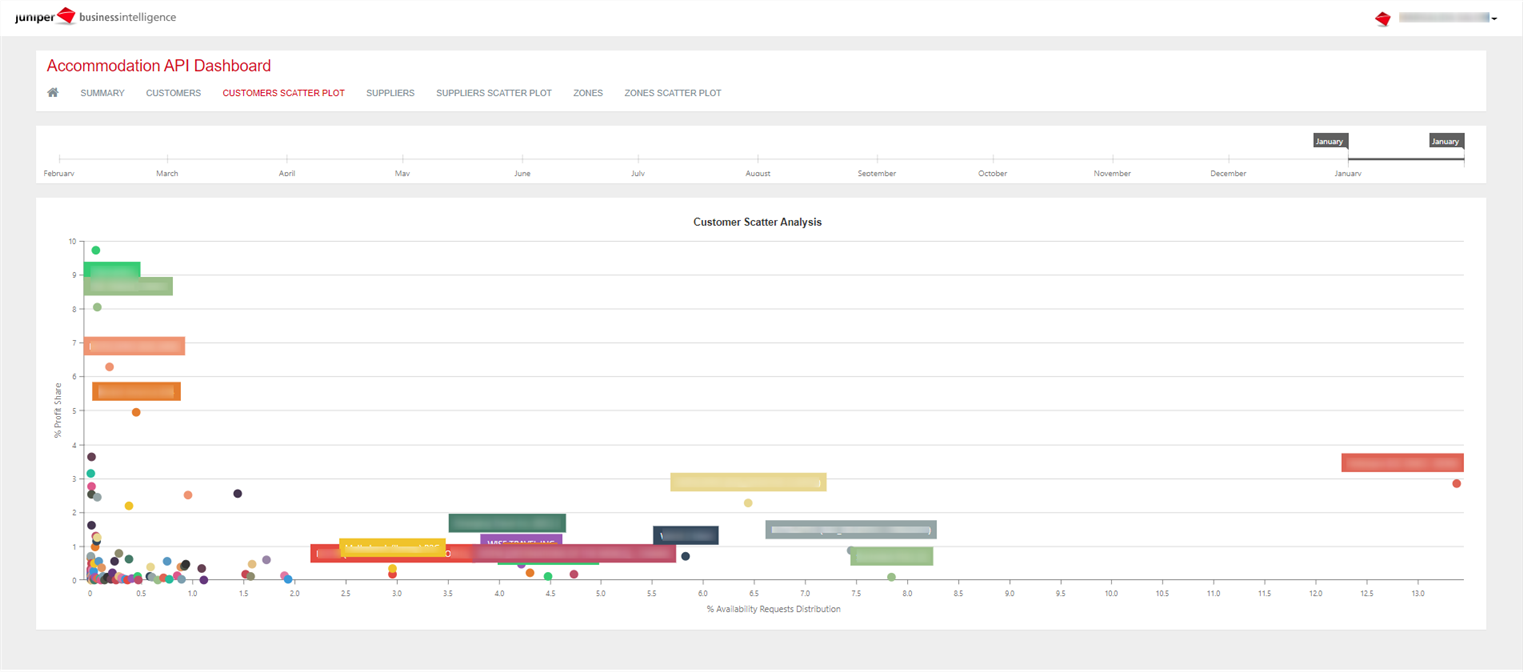
Tab 3: Scatter Customers
This report shows the proportion between the percentage that each client represents in the total system requests and the percentage of profit over the total.
This graphic allows you to zoom on the graphic using the mouse. In addition, standing on each of the pints you can view more information such as total number of requests, sales, reservations or Look2Book.
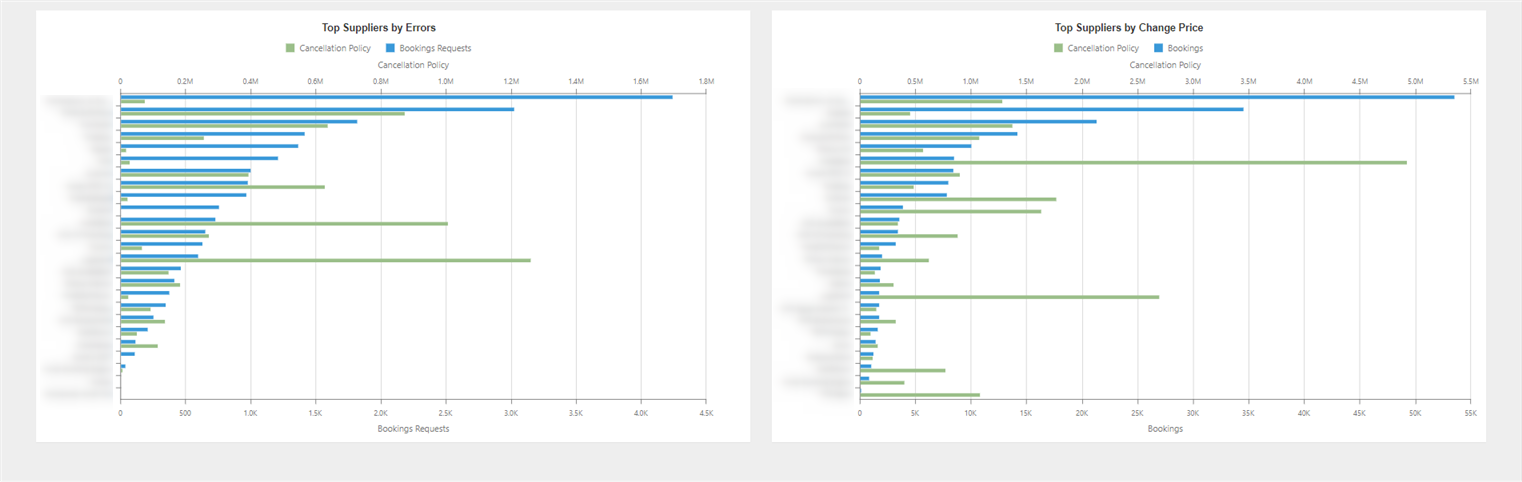
Tab 4: Suppliers
This dashboard provides information regarding the suppliers business trend. In addition to the production and graphics described above, you can see the errors of each supplier, the most requested or the errors returned by price changes.
Tab 5: Scatter Suppliers
Report similar to Customers Scatter plot but broken down by suppliers.
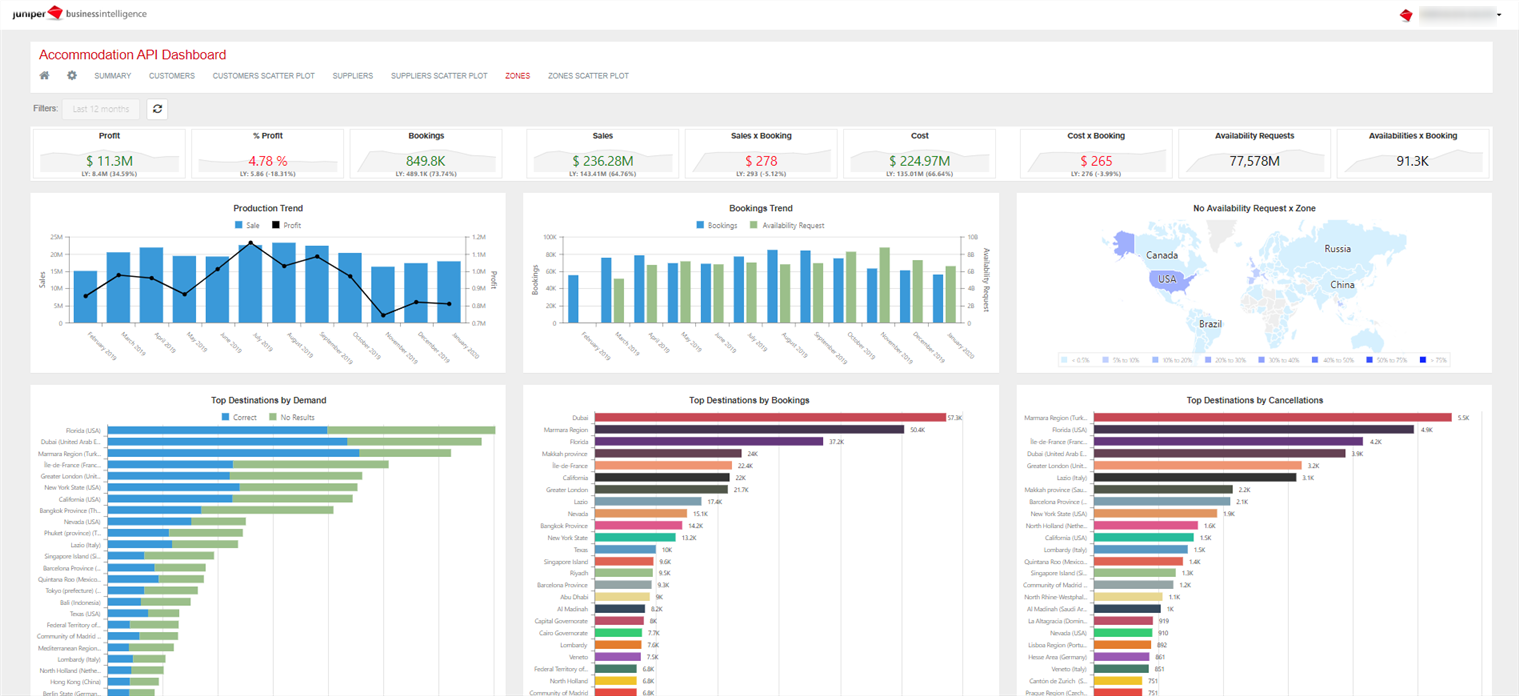
Tab 6: Zones
This dashboard provides information regarding hotel areas, as well as production, bookings or requests by zone.
Tab 7: Scatter Zones
Report similar to Customers Scatter plot but with zone breakdown.
¶ 3. Direct Contracting
Thanks to this report, you can access information related to the hotel bookings of your business, focused on direct-contracting hotels. The idea of this dashboard is giving you a comprehensive control over the direct product from a business point-of-view.
Following the structure of the other dashboards, you will find a top horizontal menu bar giving you access to several views for the same database. Also, when accessing any of the menu tabs, you will find a filter bar that allows you to control both the booking and trip dates, zoom in on a specific customer or supplier, and even get to the hotel level.
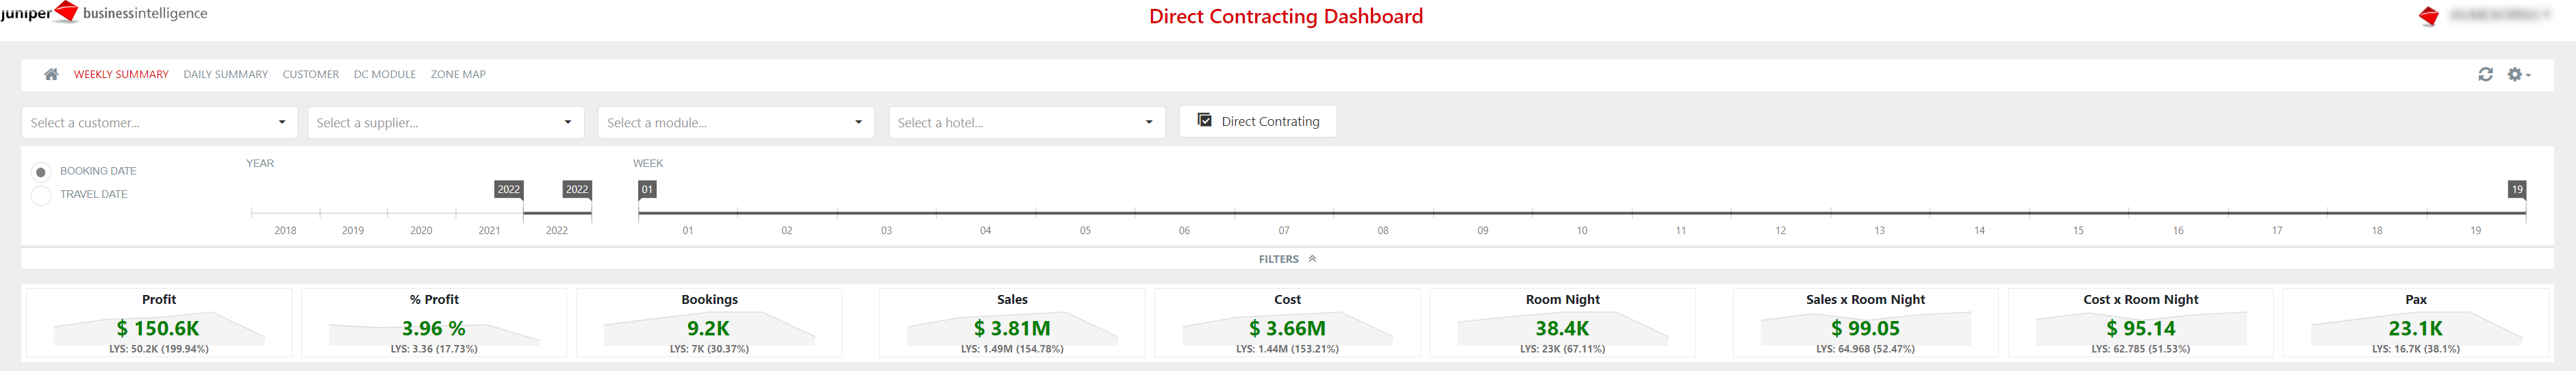
In each view, just under the filters, you will find a numerical summary of all the charts that intervene in that tab.
Let us see in more detail the charts present in each tab of the main menu.
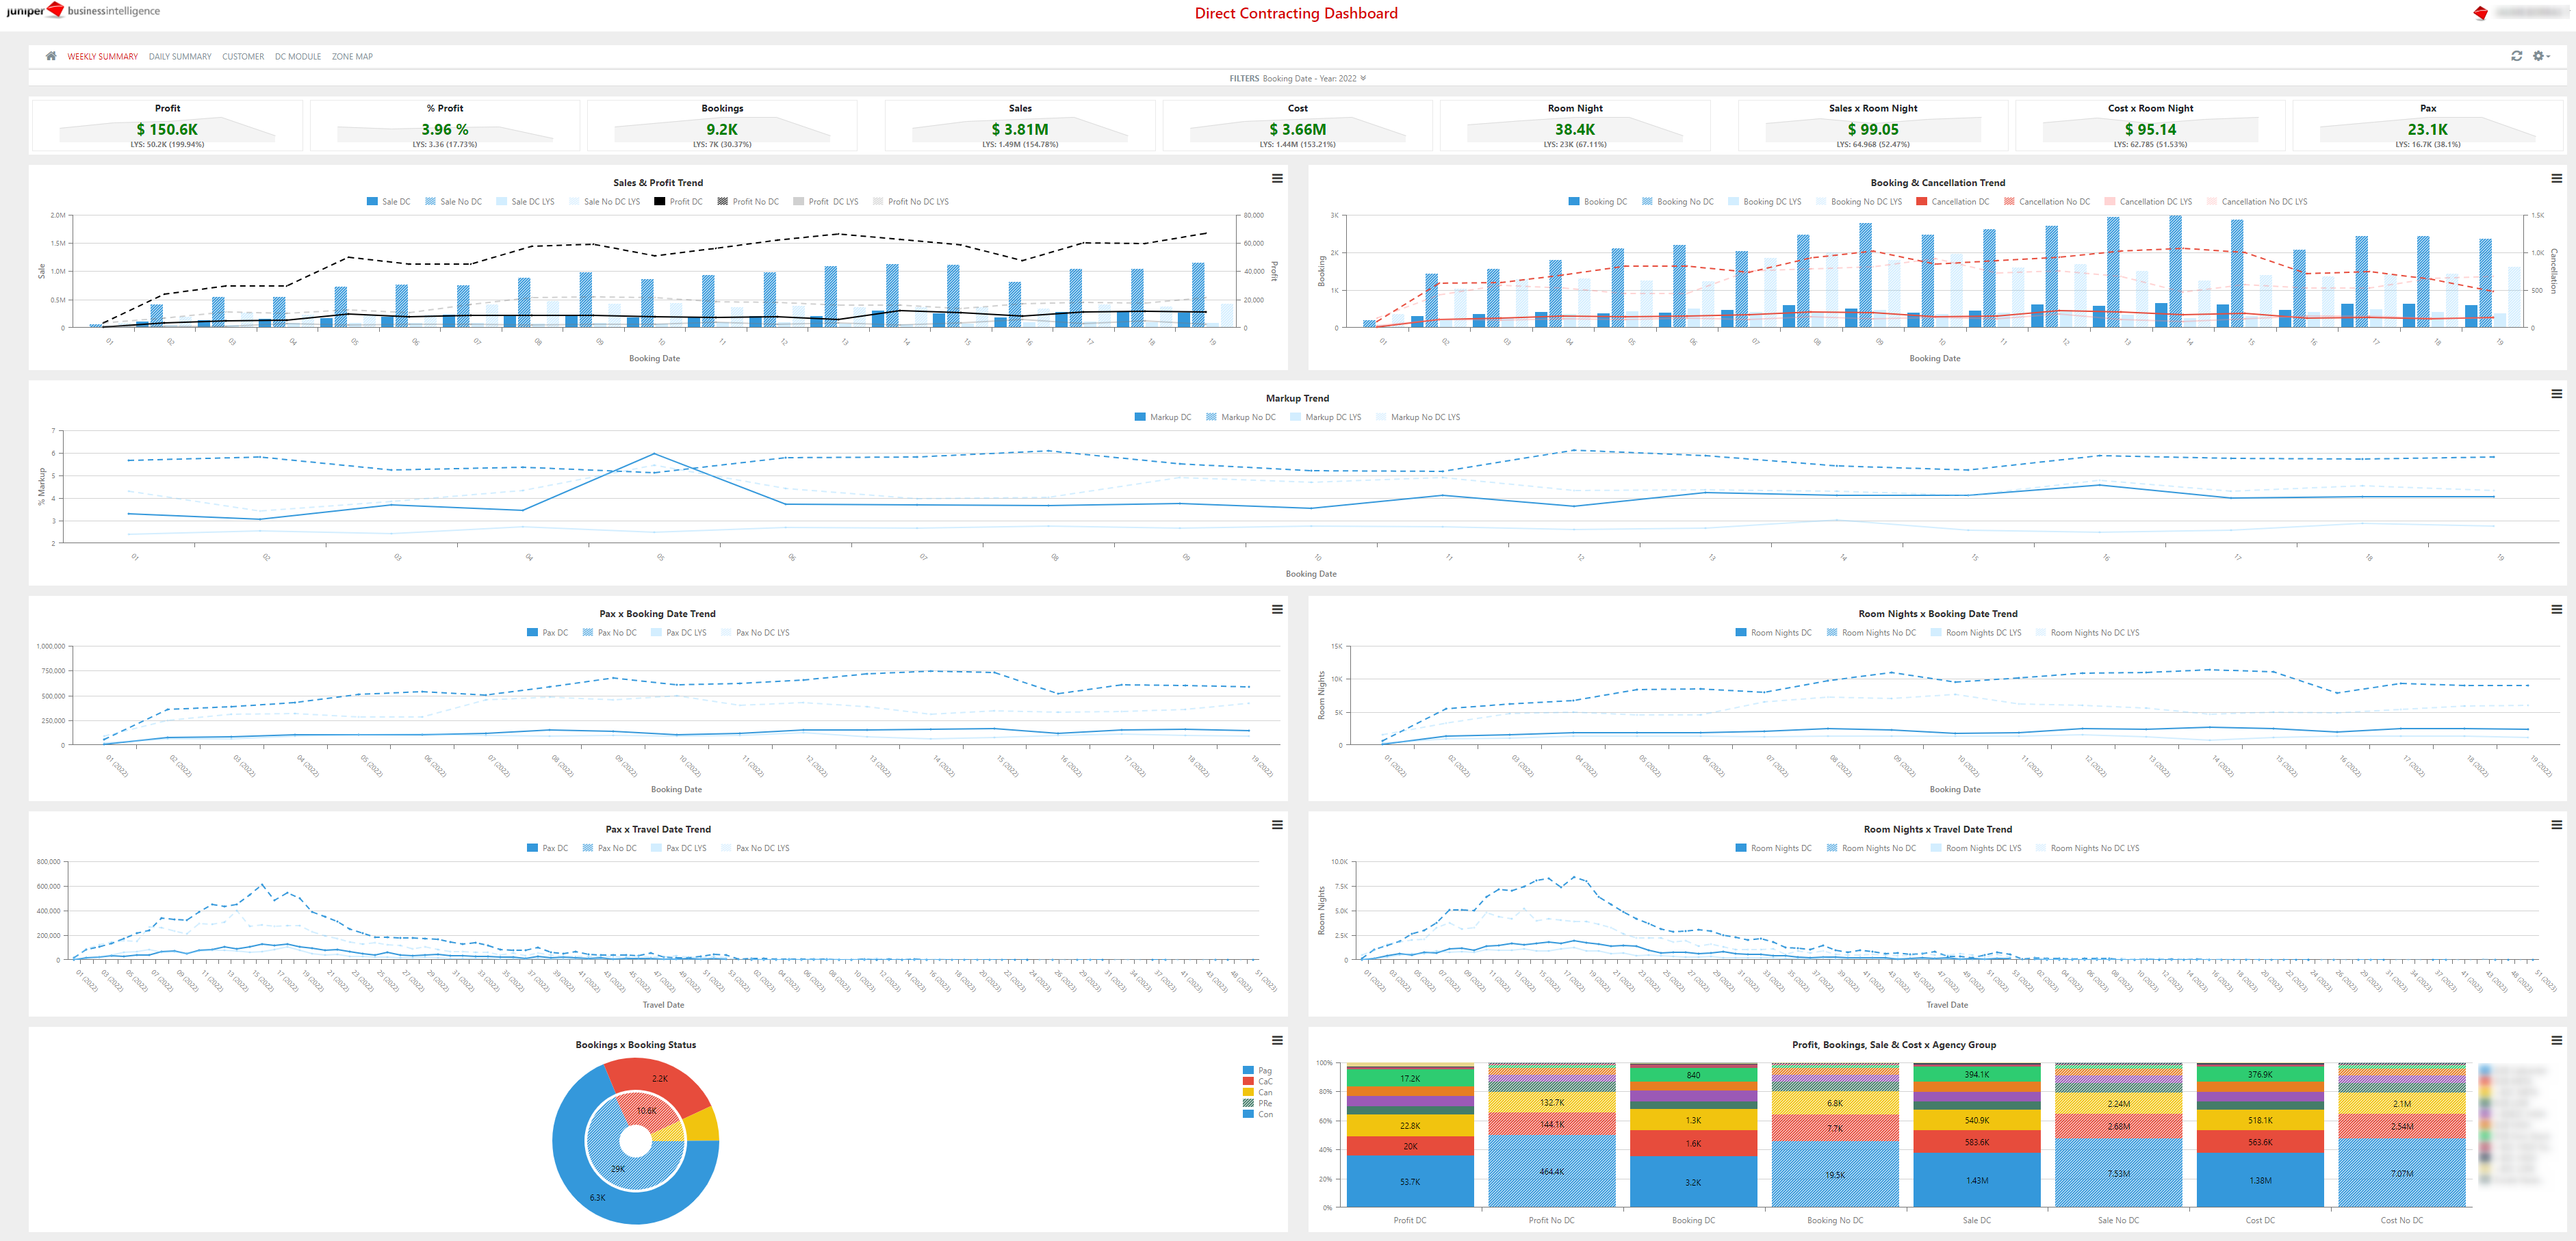
Tab 1: Weekly Summary
This tab allows to compare the evolution of the information per weeks. All the charts can be filtered by the data related to direct or external product.
- Sales & Profit Trend: Trend of the sales and profit per week during the period selected.
- Booking & Cancellation Trend: Trend of the bookings and cancellation requests per week.
- Markup Trend: Trend of the percentage profit per week during the period selected.
- Pax Booking Date Trend: Evolution of the number of passengers per booking week.
- Room Nights Booking Date Trend: Evolution of the number of booked nights per booking week.
- Pax Travel Date Trend: Evolution of the number of passengers per trip week.
- Room Nights Travel Date Trend: Evolution of the number of booked nights per trip week.
- Bookings x Booking Status: Amount of bookings according to the different statuses.
- Profit, Bookings, Sale & Cost x Agency Group: Percentage of profit, bookings, sales and costs that each agency group represents with regard to the total.
Tab 2: Daily Summary
This tab provides you the same information as the previous one, broken down by days. According to the breakdown, you will find the temporality per day and month in the subfilters.

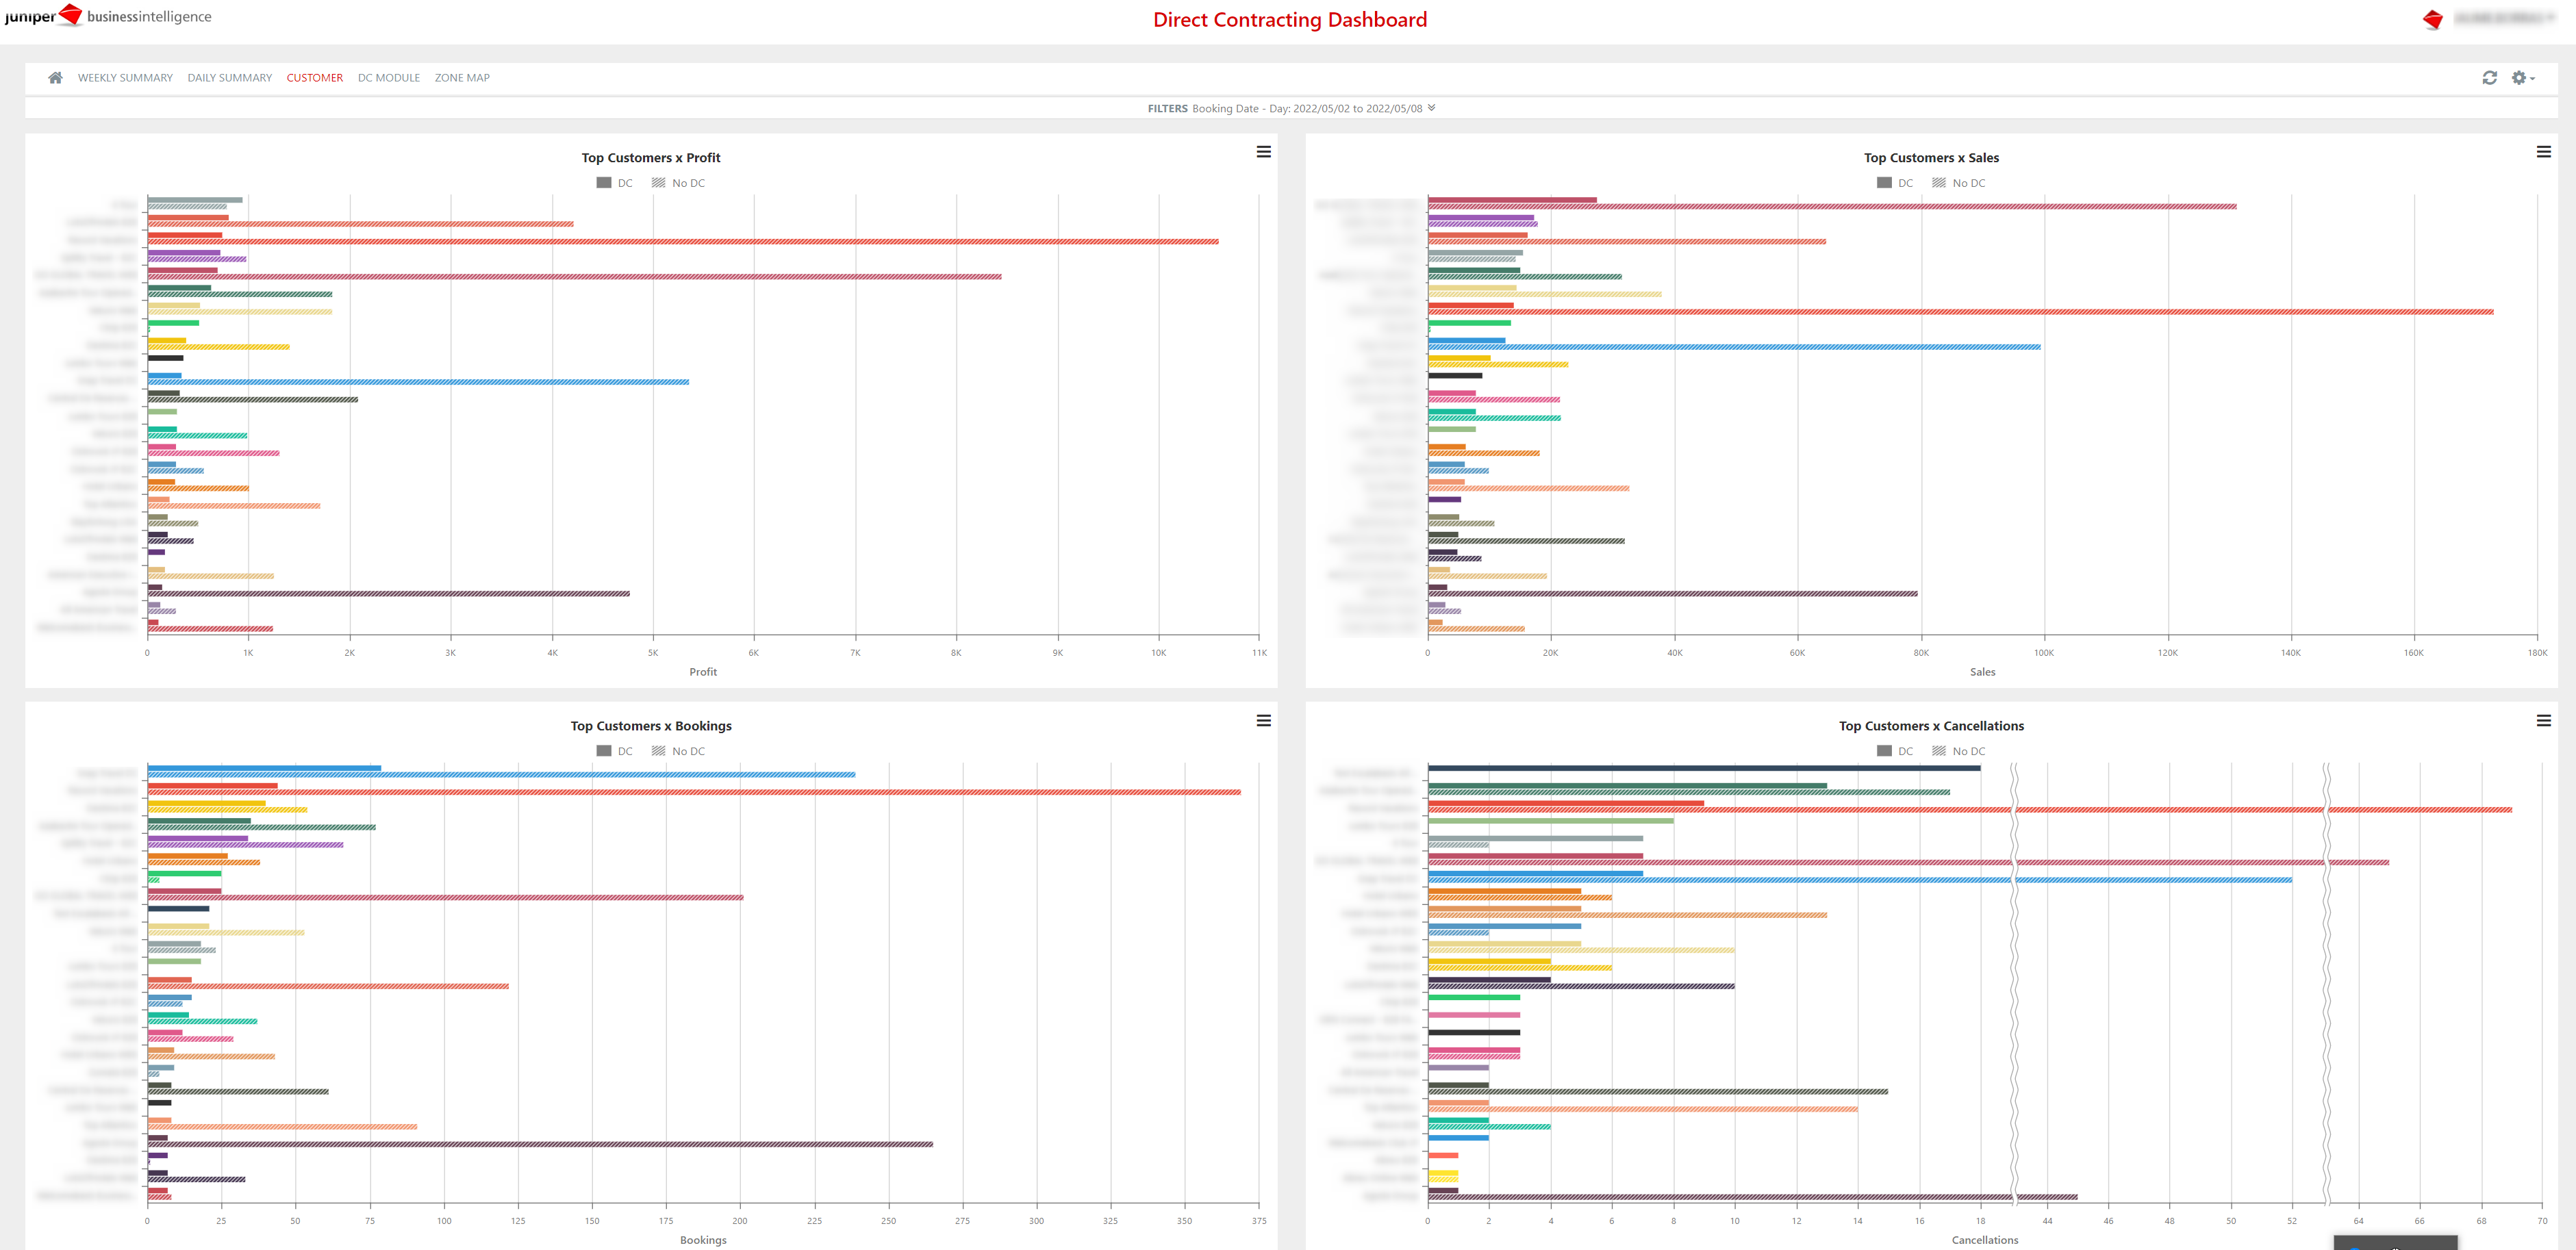
Tab 3: Customer
This view of the cube provides a breakdown of the sales, profit, bookings and cancellations by agency. All the information in this section is provided by charts from horizontal bars. These charts, enumerated below, can be clicked on to view the information related to direct-contracting or only that from third parties:
- Top Customers x Profit: Customers with most profit during the period selected.
- Top Customers x Sales: Customers with most invoicing during the period selected.
- Top Customers x Bookings: Customers with most bookings during the period selected.
- Top Customers x Cancellations: Customers with most cancellations during the period selected.
Tab 4: DC Module
This view of the cube provides a breakdown of the sales, profit, bookings and cancellations per supplier or module. All the information in this section is provided by charts from horizontal bars.
- Top Modules x Profit: Modules with most profit during the period selected.
- Top Modules x Sales: Modules with most invoicing during the period selected.
- Top Modules x Bookings: Modules with most bookings during the period selected.
- Top Modules x Cancellations: Modules with most cancellations during the period selected.
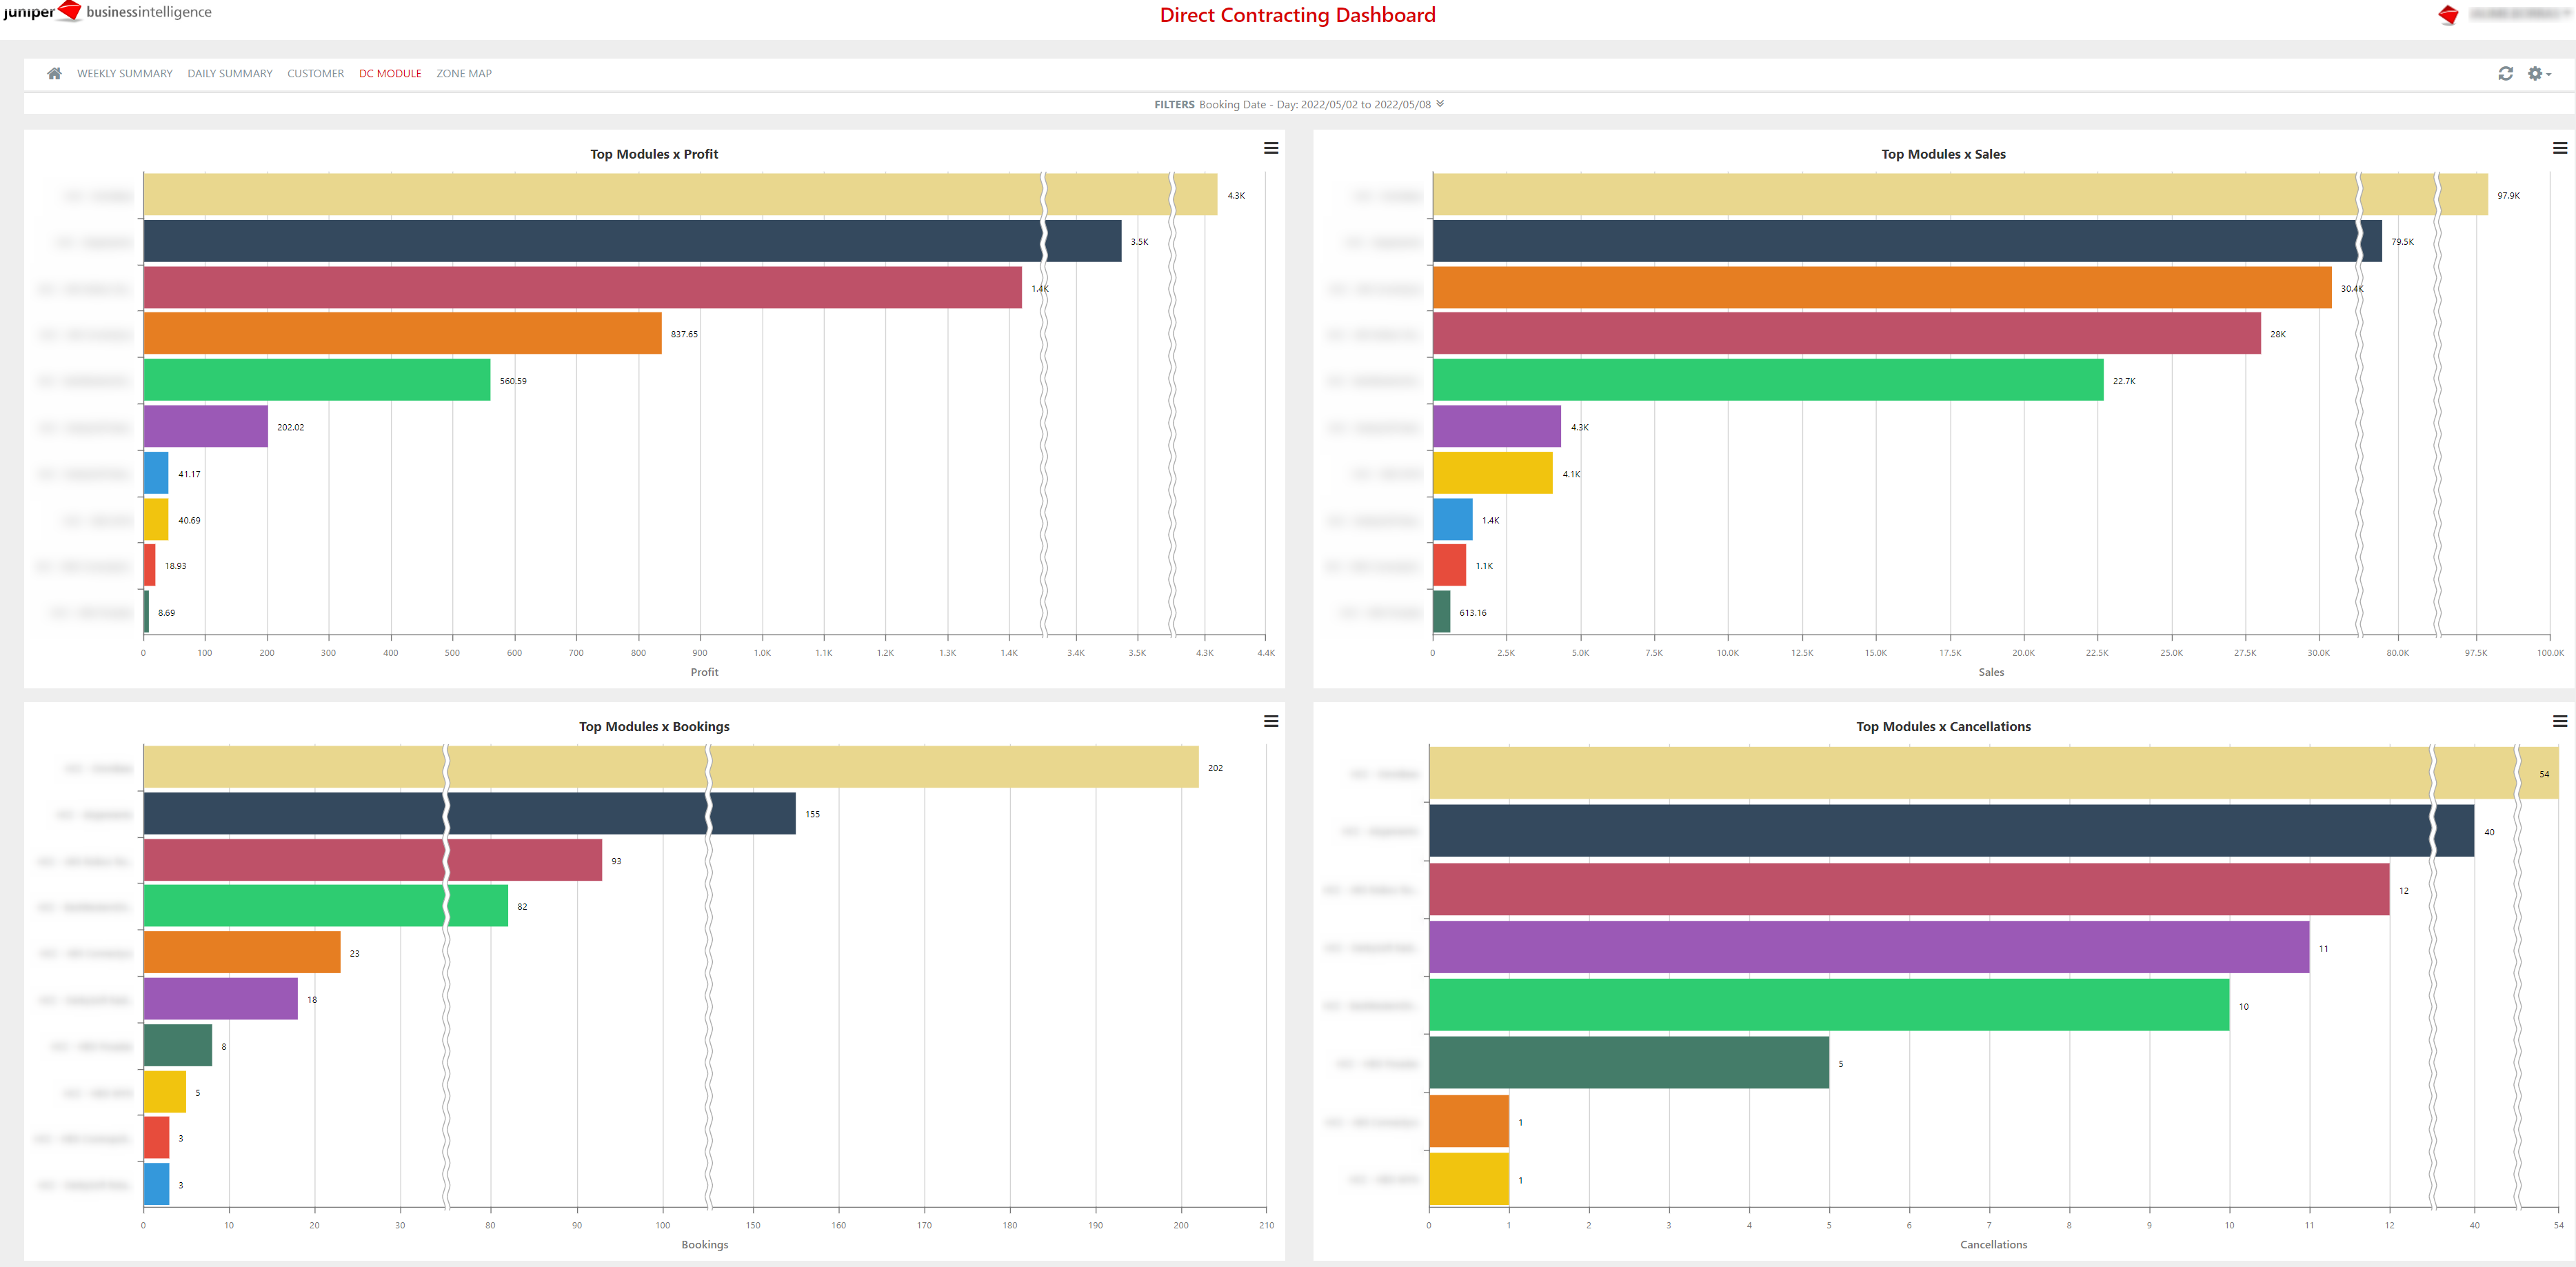
As we mentioned in the heading of this section, the information described above can be seen by zooming in on a customer or hotel.
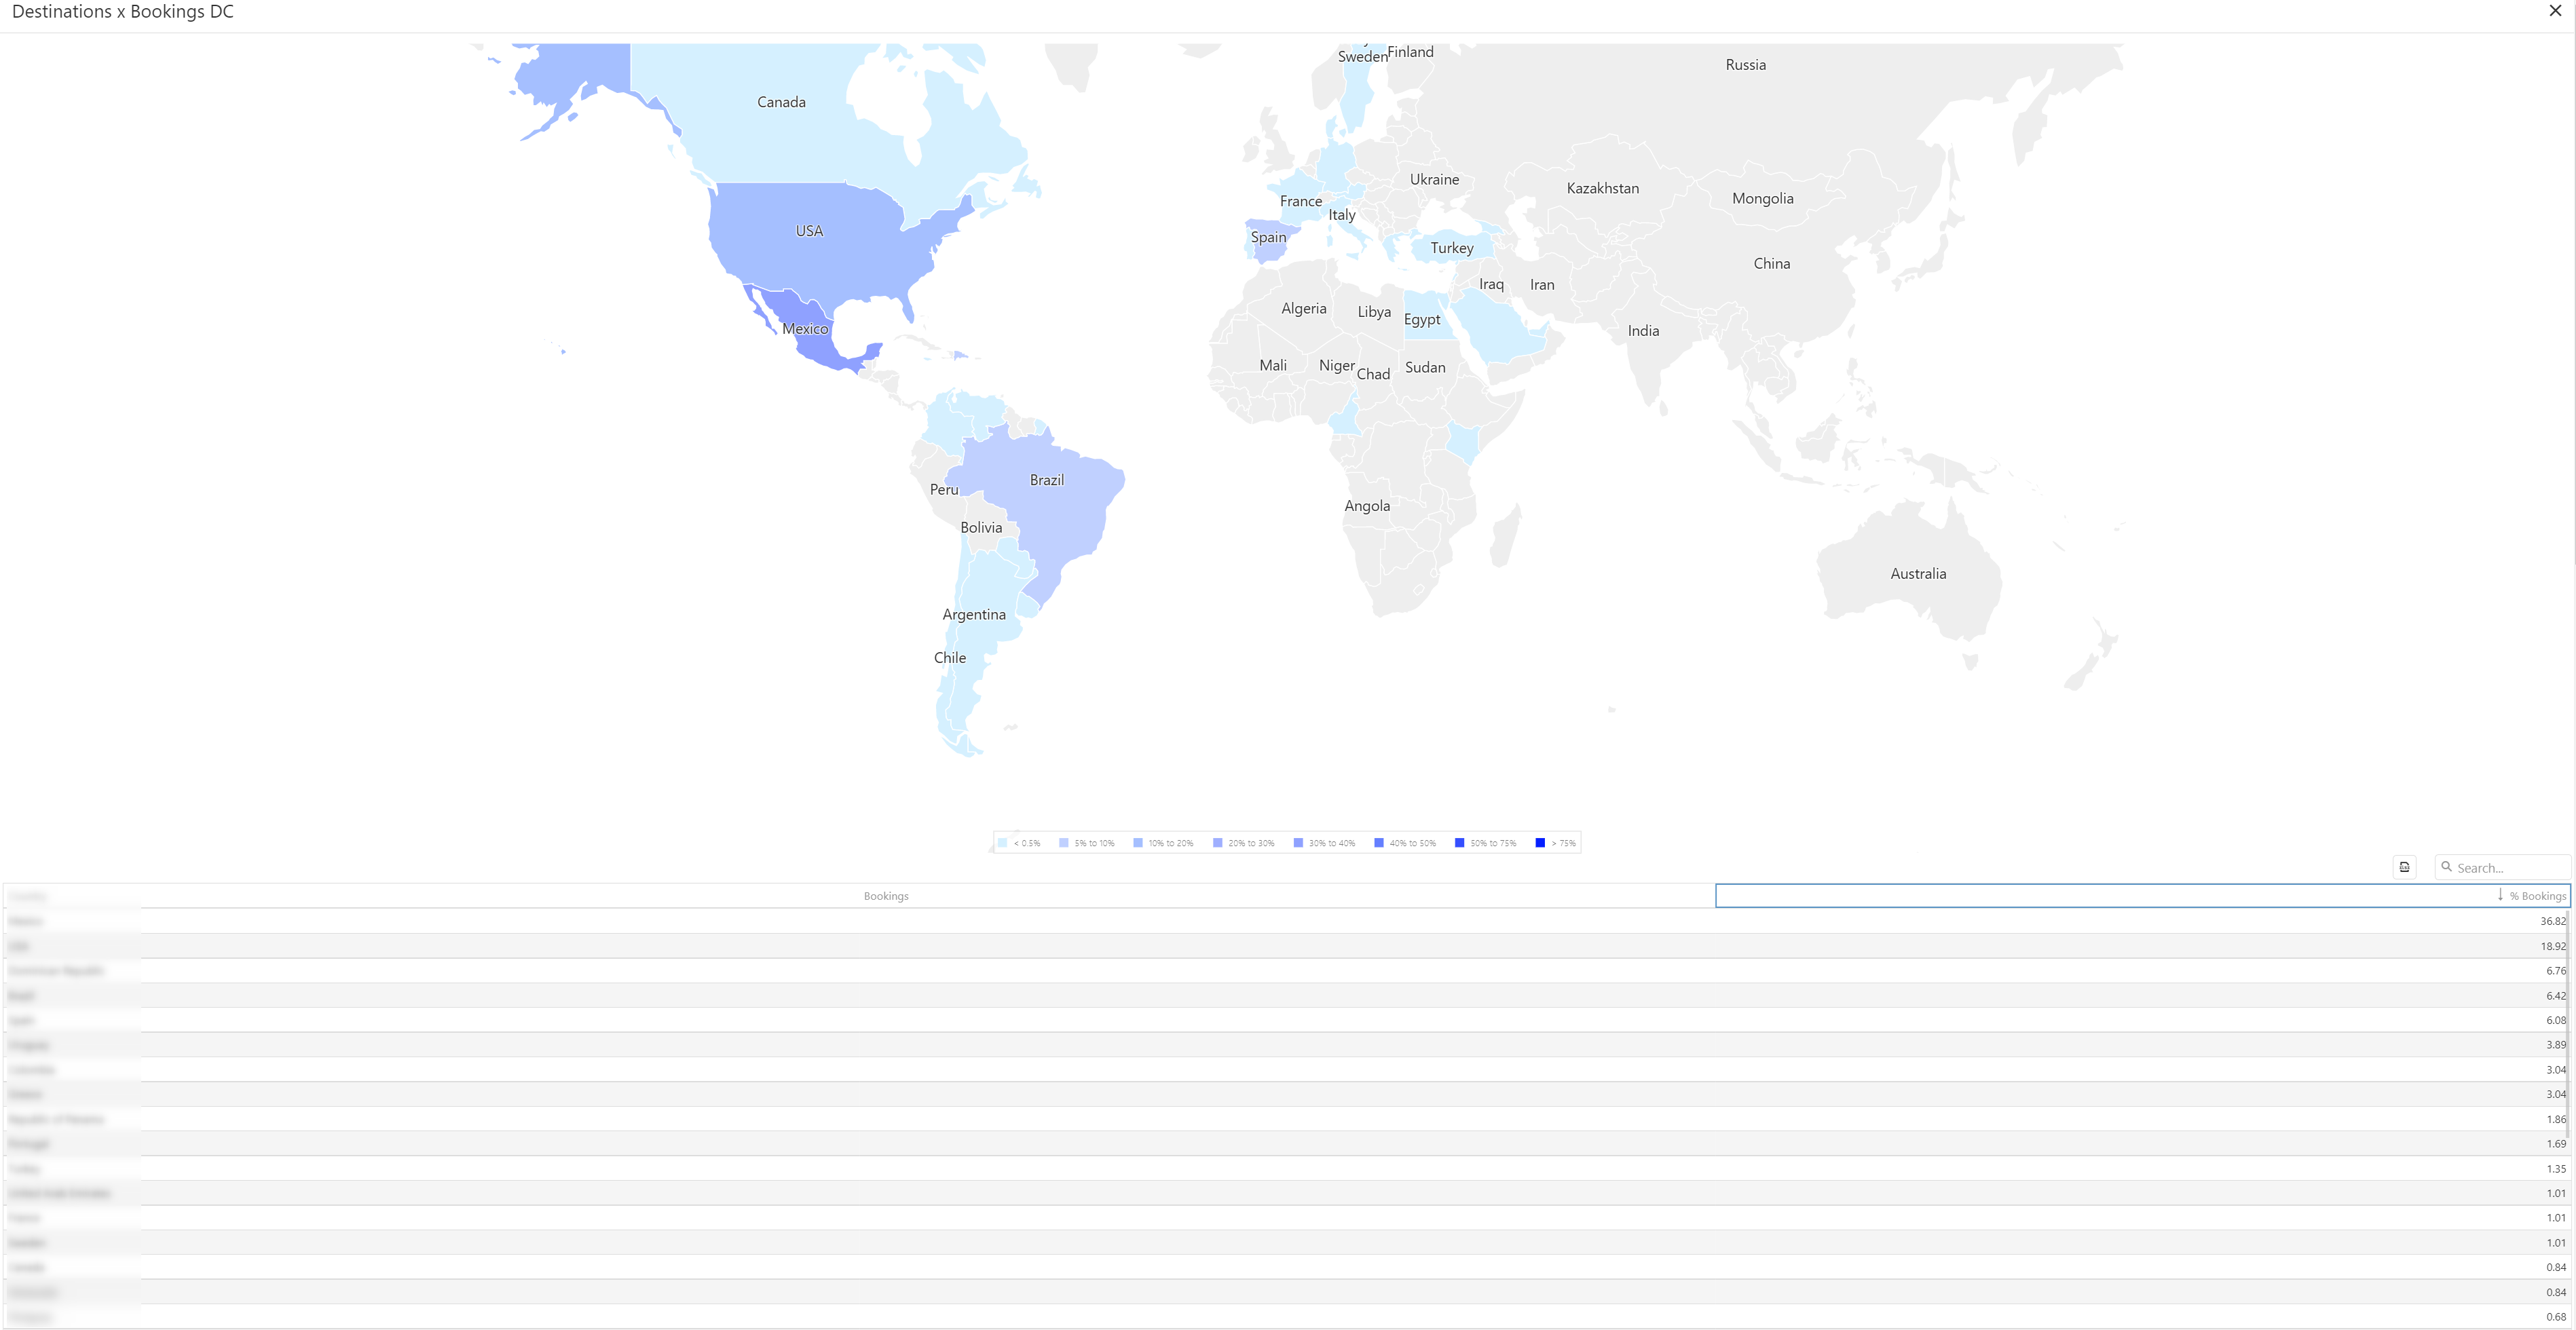
Tab 5: Zone Map
This section presents four charts in the form of heat maps. It is a general overview by colours to identify the areas with most sales.
- Destinations x Bookings DC: It shows the areas with most direct-contracting hotel bookings.
- Destinations x Cancellations DC: It presents the areas with most direct-contracting hotel cancellations.
- Destinations x Bookings Difference: It allows you to view the areas with the greatest difference between the sales to third parties and the direct ones.
- Destinations x Sales Difference: It conveys the areas with the greatest difference between the cancellations to third parties and the direct ones.
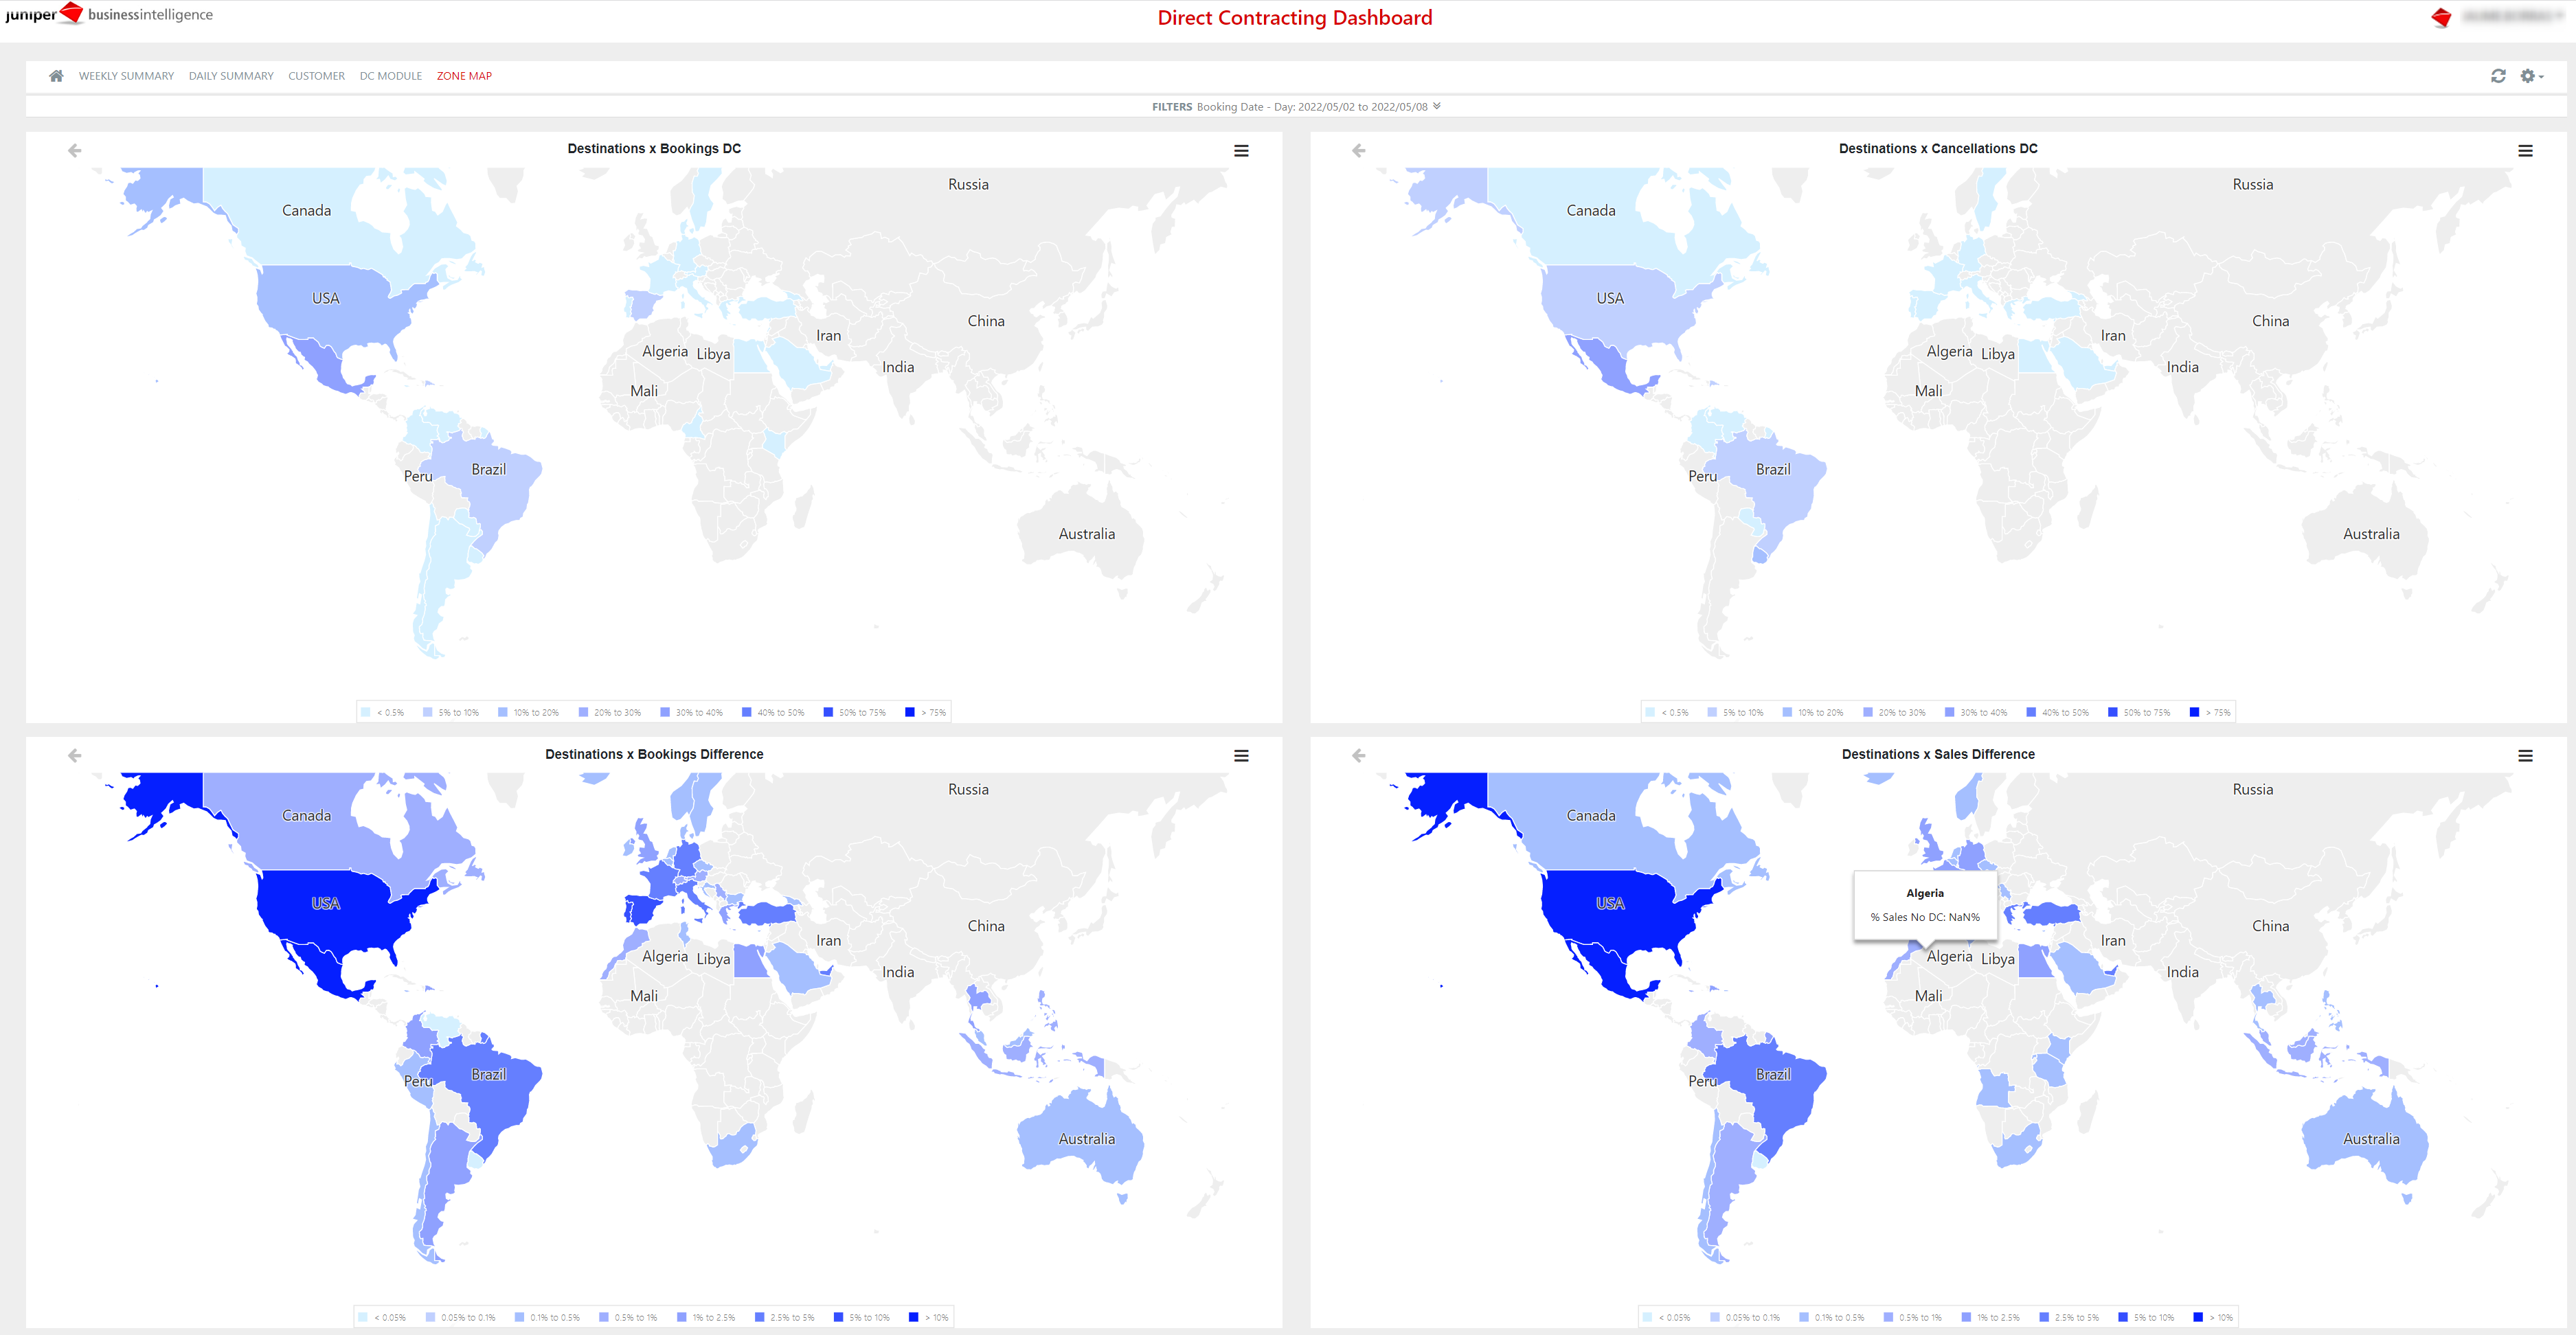
This section allows to view in full screen each of the charts, and thus to see a table with the numbers the maps are based on.
With this report we can obtain the mean booking night price in our ownstock hotels.
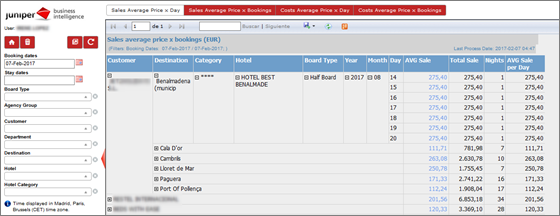
In the example we can see that all august nights have the same. But, in the next example:
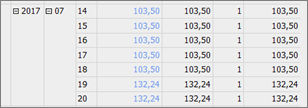
We can see that the price changes in the last two days, it depends on the sells-contract configuration.
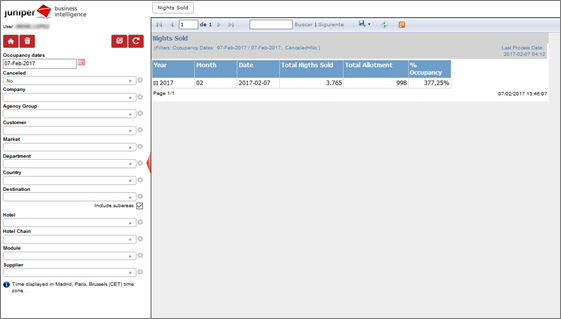
¶ 4. Nights Sold
With this report we know the total number of nights that have been sold. The table shows the information broken down by year, month and date, total nights sold, total accommodations and occupancy rate.
¶ 5. Relocations
This report shows bookings affected by relocation.
Tab 1: Relocations x Accomodations
Data are shown based on the dates inserted in the filter.
Whereas the chart to the left shows relocations per bookings made throughout the year, the chart to the right shows relocations per bookings made throughout the month.
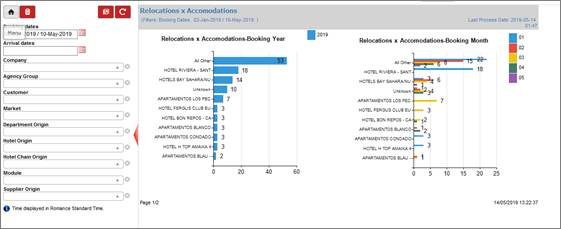
The table shows the original hotel, the hotel receiving the relocation, the total number of bookings affected by relocation and the number of bookings affected by relocation per month.
Tab 2: Relocations x Customers
Here, information is shown per customer. Therefore, the table displays the same information included in the previous report, only that, in this case, it is broken down per customer.
Tab 3: Relocations x Departments
This report shows the same information as previous reports. The only difference is that, in this case, data are segmented by department.
¶ Ticket Sales
In the next section we will explain the different reports that exist to give you information about the sales and bookings of your business.
¶ 1. Tickets
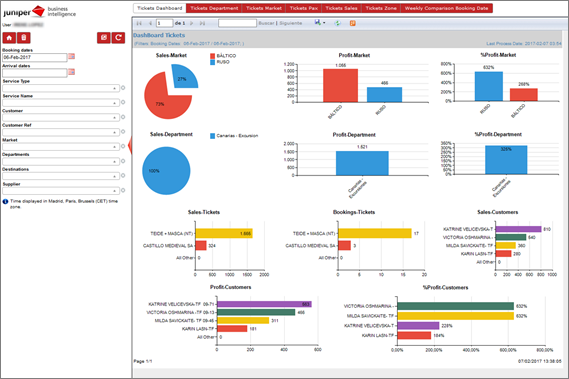
Tab 1: Tickets Dashboard
This report offers information regarding the number of excursions sold and the profit generated. Available charts are:
- Sales-Market: This chart will show the percentage of sales per market.
- Profit-Market: This chart will show the percentage of profit per market.
- % Profit-Market: This chart will show the percentage of profit per market.
- Sales-Department: This chart will show the percentage of sales per department.
- Profit-Department: This chart will show the percentage of profit per department.
- % Profit-Department: This chart will show the percentage of profit per department.
- Sales-Tickets: This chart will show the percentage of sales per ticket (service name).
- Reservas-Tickets: This chart will show the percentage of bookings per ticket (service name).
- Sales-Customer: This chart will show the percentage of sales per customer.
- Profit-Customers: This chart will show the percentage of profit per customer.
- % Profit-Customers: This chart will show the percentage of profit per customer.
Tab 2: Tickets Department
There are two available charts: the first one shows the top departments in the sales-and-cost ranking; the second one shows the top departments by total packages. This chart also shows the total number of packages from the previous year.
Information by department is shown in the data table (next page). Each department is broken down showing information by month of arrival and month of booking.
Tab 3: Tickets Market
The only difference with the previous chart is that, in this one, the information is organized by market rather than by department.
Tab 4: Tickets Zone
Information is organized by zone.
Tab 5: Tickets Sales
For this report there are three available charts:
- The first one contains tickets’ sales and costs per year, in addition to data from the previous year.
- The second one contains tickets’ sales and costs per month.
- The last one contains the top 10 tickets with greatest sales and costs.
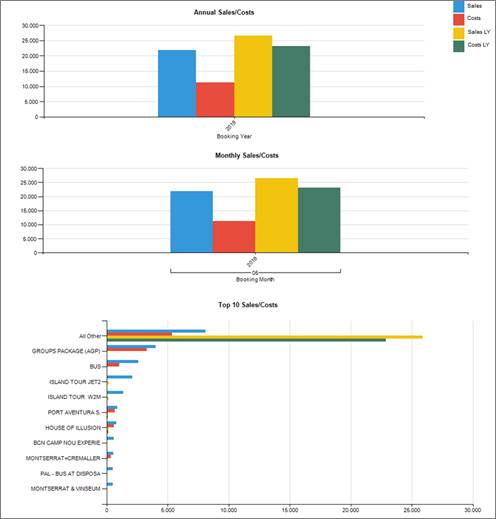
The next pages show information displayed on a table. Each ticket can be broken down by Option. Likewise, Options can be broken down by customer.
Tab 6: Weekly Comparison booking Dates
A table will show the amount of sales and costs per ticket (Service name), by week.
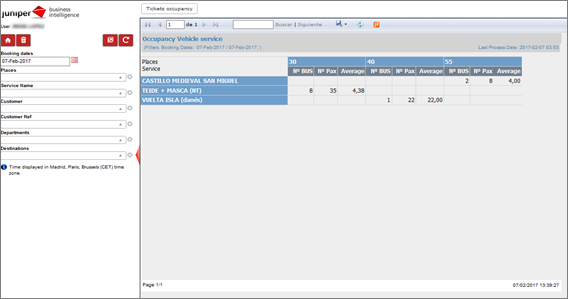
¶ 2. Tickets Occupancy
This report shows the number of seats sold.
¶ Accounting
This module contains accounting reports. You only see it if you have contracted accounting module.
¶ 1. Pending Payment Bookings
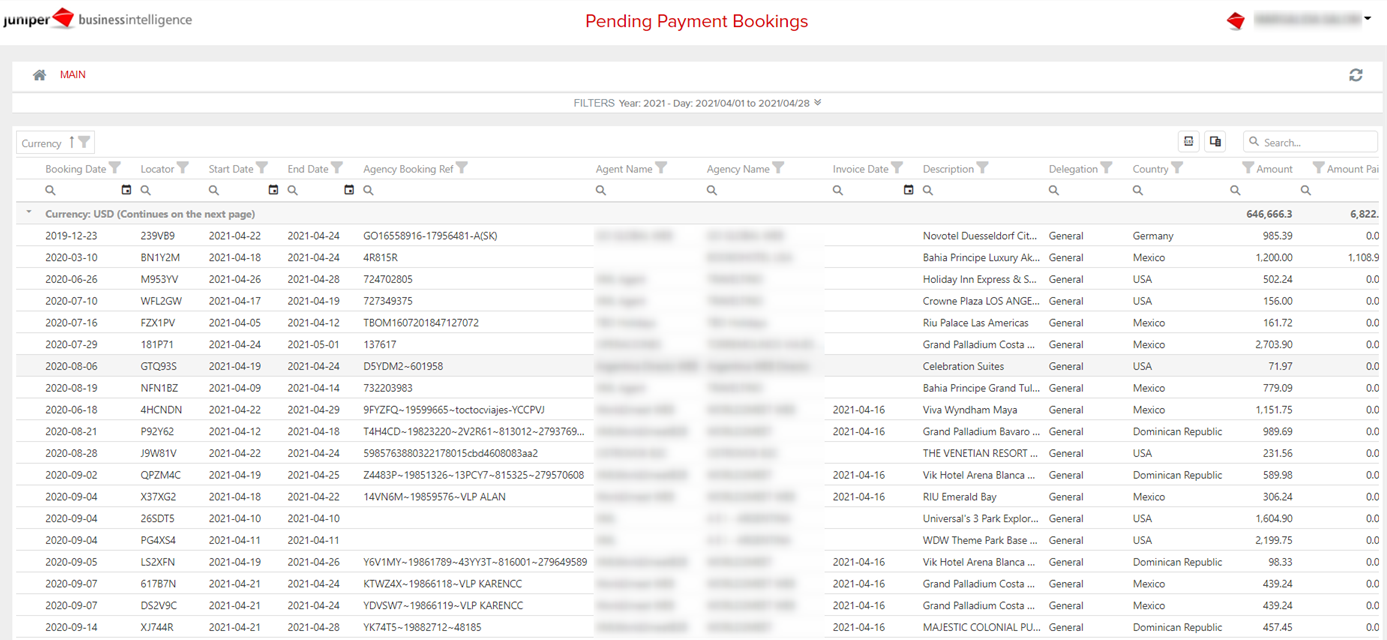
This report allows you to analyze the pending payment bookings. At the top there is a filter that will allow you to select the desired dates and year. By default, the reservations of the current month will be shown.
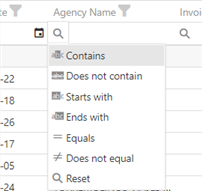
On the top of the table you have a button to export to excel, as well as to change the columns of the table displayed. Under the header of the column it has multiple functionalities, such as adding or excluding some agencies, specific dates or nacionalities.
The table has the following information available:
- Booking Date: booking date information
- Locator: booking locator
- Start Date: start travel date
- End Date: end travel date
- Agency Booking Ref: booking reference provided by the agency
- Agent Name: agent name
- Agency Name: agency name
- Invoice Data: invoice date
- Description: service description
- Delegation: delegation
- Country: country of the contracted service
- Amount: final booking amount
- Amount Paid: reservation amount paid
- Amount Pending: reservation amount pending
- Invoice Amount: total amount to invoice
- Invoiced Amount Pending: amount pending to invoice
¶ Booking Payments
With this report, you will see detailed information about the effectiveness of payments.
At the top of the dashboard, you will find different tabs with information that will be detailed hereunder. Just below, minimised, are the filters that allow you to select the customer, the type of ‘direct’ supplier and the supplier, as well as the different dates per day (creation date, travel date and collection date).
Just below is a summary showing the main data of your business, such as total payments, payment amount, average payment amount, number of errors, percentage of payments with no errors, percentage of successful payments and total number of booking lines.

Next, we'll break down the different graphs and the information they provide:
- Payments trend: Total collections per day (in the image above).
- Revenue x payment type trend: Amount of collections per payment method per day.
- Revenue x payment type trend: Amount of collections per payment method.
- Top customers x payment trend: Top customers with most payments made.
- Errors trend: Total errors per day, for each of the error types (booking, transaction and anti-fraud).
- Payments per market: Total payments per market.
- Payments x channel: Total payments per channel.
- Payments x product type: Total payments per product type.
- Payments x gateway: Total payments per payment gateway.


These charts are identical in the first three tabs, by day (Daily Summary), by week (Weekly Summary) and by month (Monthly Summary).
Gateway: In this tab we will go deeper into the payment gateways.
- Top Gateways x Revenue: Top payment gateways by transaction amount.
- Top Gateways x Transactions: Top payment gateways by transactions.
- Top Gateway x Errors: Top payment gateways by error type.
- AVG time of payment gateway transaction finalisation: Average time of payment gateway transaction finalisation per day.
- Transactions x Product Type: Total transactions per product type.
- Transactions x Channel: Total transactions per channel.
- Transactions x Market: Total transactions per market:


Customer: In this tab you will find information per customer.
- Top Customers x Revenue: Top customers per payment amount.
- Top Customers x Payments: Top customers per payment.
- Top Customers x Errors: Top customers per error type.
- Payments x Product type: Total payments per product type.
- Payments x Payment type: Total payments per payment type.
- Payments x Channel: Total payments per channel.
- Payments x Market: Total payments per market.


Supplier: In this tab we will see the information per supplier.
These are the same charts but from the supplier's view.


Errors: In this tab we will see different charts for the errors.
- Errors trend: Total errors per day, for each of the error types (booking, transaction and anti-fraud).
- Top Customers x Errors trend: Top customers with the most errors.
- Top Gateways x Errors trend: Top payment gateways with the most errors.
- Top Module type x Errors trend: Top suppliers with most errors.
- Errors x Product type: Top errors per product type.


¶ Flights
In the following section, we will explain the different reports that exist and are at your disposal to let you know about the flight bookings and sales of your business.
¶ Flight Bookings
This report will allow to see information related to the flight bookings of your business.
In the upper part of the dashboard, are found different tabs where we will find information we will explain below. Just underneath, we will find the minimized filters that will allow to select the customer, module of the booking line, supplier, operating airline, airports of origin and destination and category of the trip, in addition to having a yearly and monthly timeline according to the booking date or departure date of that flight.

1. Monthly summary: In this tab, the evolution of the information will appear per months.
Under the filters, on the dashboard itself, we will find a summary in which the main data of your business will be displayed, such as the profit, number of bookings or passengers, among others.

We will detail below the different charts and the information they provide:
- Bookings & Cancellations trend: Trend of bookings and cancellation requests per month.
- Sales & Profit x Booking date trend: Trend of sales and profits of the bookings per month (during the month in which the booking was made).
- Sales & Profit x Departure date trend: Trend of sales and profits of the bookings per month (during the month in which the booking was enjoyed).
- Booking Avg Sales & Profit x Booking date trend: Trend of the average sales per booking and their profit per month (during the month in which the booking was made).
- Booking Avg Sales & Profit x Departure date trend: Trend of the average sales per booking and their profit per month (during the month in which the booking was enjoyed).
- Bookings x Booking status: Number of bookings and different statuses of the bookings.
- Bookings x Channel: Number of bookings according to the channel through which they have been made.
- Bookings, tickets, segments, profit, sales & costs x Market: Percentage and total number of bookings, tickets, segments toured, profits, sales and costs for each market.


2. Weekly summary: On this tab, we will find the same charts as on the previous one, but broken down per weeks.


3. Daily summary: On this tab, we will find the same charts as on the previous one, but broken down per days.


4. Pax flow: We will find here information on the flow of the booking pax.
We only have two charts on this tab:
- Pax flow departure country to arrival country: Threads (flow) of pax from the flight country of origin to the flight country of destination.
- Pax flow departure city to arrival city: Threads (flow) of pax from the flight city of origin to the flight city of destination.

5. Route: We will find on this tab the charts representing the main airports according to the following criteria:
- Top airport departure/arrival x Pax: Number of pax in both origin and destination airports, sorted by descending order.
- Top airport departure/arrival x Profit: Profit in both origin and destination airports, sorted by descending order.
- Top airport departure/arrival x Bookings: Number of bookings in both origin and destination airports, sorted by descending order.
- Top airport departure/arrival x Cancellations: Number of cancellations in both origin and destination airports, sorted by descending order.

6. Operative airline: We will find on this tab the charts representing the main operating airlines according to the following criteria:
- Top operative airline x pax: Number of pax of the airlines, sorted by descending order.
- Top operative airline x profit: Profit of the airlines, sorted by descending order.
- Top operative airline x bookings: Number of bookings of the airlines, sorted by descending order.
- Top operative airline x cancellations: Number of cancellations of the airlines, sorted by descending order.

7. Module: We will find on this tab the charts representing the main modules according to the following criteria:
- Top module x pax: Number of pax of each module, sorted by descending order.
- Top module x profit: Profit of each module, sorted by descending order.
- Top module x booking: Number of bookings of each module, sorted by descending order.
- Top module x cancellations: Number of cancellations of each module, sorted by descending order.

8. Supplier: We will find on this tab the following charts representing the main suppliers, broken down by criterium:
- Top supplier x pax: Suppliers with the highest number of pax, sorted by descending order.
- Top supplier x profit: Profit of the suppliers, sorted by descending order.
- Top supplier x bookings: Suppliers with the highest number of bookings, sorted by descending order.
- Top supplier x cancellations: Number of cancellations of the suppliers, sorted by descending order.

9. Other: We will find on this tab the following charts related to other areas:
- Bookings x lead times: Number of bookings according to the different lead times, that is, according to the difference between the flight departure date and booking date.
- Bookings x with stops: Contrast and number of bookings whose flights have stopovers or are direct.
- Bookings x fare types: Number of flight bookings according to the type of fare.
- Bookings x cabin class: Number of flight bookings according to the type of cabin class.
- Bookings x domestic category: Number of bookings according to the type of flight (national or international).
- Bookings x trip category: Contrast and number of bookings according to the type of flight (multi-destination or one way).
